|

USD/RUB Price Analysis: Bears retake control with eyes sub-60.00 region

  • USD/RUB takes offers to renew intraday low, extends pullback from three-week top.
  • Break of short-term support line, failures to stay beyond 100-SMA keep bears hopeful.
  • Weekly horizontal support, 200-SMA offer extra filters to watch.

USD/RUB remains on the back foot for the second consecutive day, extending the previous day’s pullback from a multi-day high.

In doing so, the Russia ruble (RUB) pair justifies Monday’s downside break of a one-wee-old rising support line, now resistance around 66.50, as well as sustained trading below the 100-SMA, at 64.00 by the press time.

Given the absence of oversold RSI, coupled with the aforementioned trading pattern, the USD/RUB weakness is likely to prevail.

That said, the 61.00 and the 60.00 round figures may offer immediate supports to the pair bears.

However, a one-week-long horizontal support zone near 58.00, followed by the monthly low near 55.90, can challenge the USD/RUB downturn afterward.

On the contrary, a clear upside break of the support-turned-resistance level of 66.50 will need validation from the recent swing high surrounding 68.30, as well as the 200-SMA level of 69.91, to convince the pair buyers.

Overall, USD/RUB bears retake the driver’s seat after the last week’s corrective pullback.

USD/RUB: Four-hour chart

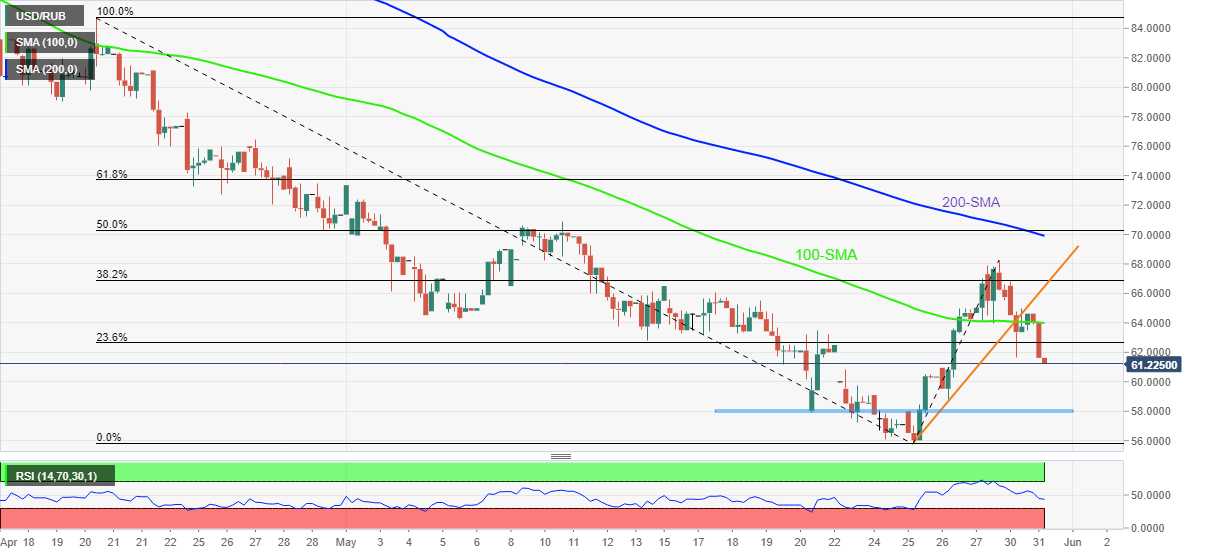
Trend: Further downside expected

Additional important levels

Overview
Today last price61.225
Today Daily Change-3.3999
Today Daily Change %-5.26%
Today daily open64.6249
 
Trends
Daily SMA2064.8612
Daily SMA5076.1265
Daily SMA10083.0003
Daily SMA20078.0016
 
Levels
Previous Daily High66.7905
Previous Daily Low61.6249
Previous Weekly High68.2501
Previous Weekly Low55.9124
Previous Monthly High89
Previous Monthly Low70.275
Daily Fibonacci 38.2%63.5982
Daily Fibonacci 61.8%64.8172
Daily Pivot Point S161.903
Daily Pivot Point S259.1812
Daily Pivot Point S356.7374
Daily Pivot Point R167.0686
Daily Pivot Point R269.5124
Daily Pivot Point R372.2342

Author

Anil Panchal

Anil Panchal

FXStreet

Anil Panchal has nearly 15 years of experience in tracking financial markets. With a keen interest in macroeconomics, Anil aptly tracks global news/updates and stays well-informed about the global financial moves and their implications.

More from Anil Panchal
Share:

Markets move fast. We move first.

Orange Juice Newsletter brings you expert driven insights - not headlines. Every day on your inbox.

By subscribing you agree to our Terms and conditions.

Editor's Picks

EUR/USD declines toward 1.1700 on solid USD recovery

EUR/USD turns south and declines toward 1.1700 on Wednesday. A solid comeback staged by the US Dollar weighs heavily on the pair, as traders look to USD short covering ahead of US CPI on Thursday. However, the downside could be capped by hawkish ECB expectations. 

GBP/USD slides toward 1.3300 after softer-than-expected UK inflation data

GBP/USD has come under intense selling pressure, eyeing 1.3300 in the European session on Wednesday. The UK annual headline and core CPI rose by 3.2% each, missing estimates of 3.5% and 3.4%, respectively, reaffirming dovish BoE expectations and smashing the Pound Sterling across the board. 

Gold clings to modest gains above $4,300

Following Tuesday's volatile action, Gold regains its traction on Wednesday and trades in positive territory above $4,300. While the buildup in the USD recovery momentum caps XAU/USD's upside, the cautious market stance helps ithe pair hold its ground.

Bitcoin, Ethereum and Ripple extend correction as bearish momentum builds

Bitcoin, Ethereum, and Ripple remain under pressure as the broader market continues its corrective phase into midweek. The weak price action of these top three cryptocurrencies by market capitalization suggests a deeper correction, as momentum indicators are beginning to tilt bearish.

Ukraine-Russia in the spotlight once again

Since the start of the week, gold’s price has moved lower, but has yet to erase the gains made last week. In today’s report we intend to focus on the newest round of peace talks between Russia and Ukraine, whilst noting the release of the US Employment data later on day and end our report with an update in regards to the tensions brewing in Venezuela.

AAVE slips below $186 as bearish signals outweigh the SEC investigation closure

Aave (AAVE) price continues its decline, trading below $186 at the time of writing on Wednesday after a rejection at the key resistance zone. Derivatives positioning and momentum indicators suggest that bearish forces still dominate in the near term.