USD/RUB flirting with 2-month tops beyond 66.00


  • The Russian currency loses further ground today.
  • Spot moves higher and retakes the 66.00 mark.
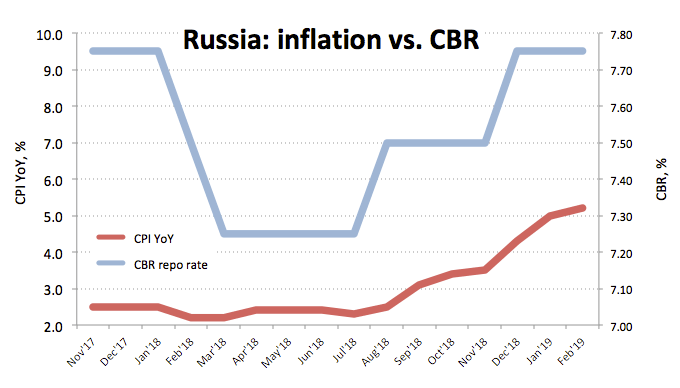
  • Russian CPI rose 5.2% YoY in February.

USD/RUB is extending the march north in the second half of the week, retaking the critical 66.00 mark and testing at the same time the area of 2-month peaks.

USD/RUB now targets the 200-day SMA

The pair is up for the third session in a row so far today, gathering extra traction following weekly lows in the mid-65.00s recorded on Tuesday.

RUB is depreciating further after Russian inflation figures matched expectations in February, rising at an annualized 5.2% (from 5.0%) and 0.4% inter-month (from 1.0%). These higher inflation figures were mainly on the back of rising food prices while the raise in the VAT seems to have also collaborated. The central bank, however, expects the effects of the raise in the VAT to last until April.

Furthermore, this uptick in consumer prices falls in line with the projected inflation from the CBR, estimated to fluctuate between 5%-5.5% bye year-end, while recent GDP figures showed the economy is running above the bank’s projection.

What to look for around RUB

The ongoing moderate trend in inflation figure plus the economy expanding above estimates could prevent the CBR from hiking rates further in the near/medium term. The central bank sees inflation picking up pace in the next months, although consumer prices should drift to the bank’s 4% target at some point in H1 2020. That said, it appears the ‘pause mode’ in the CBR could be in place for longer than expected. Furthermore, the carry-trade remains supportive of RUB along with expected higher oil prices (despite RUB seems to have decoupled from oil dynamics as of late). On the negative side, the spectre of further sanctions on Russian citizens or the economy as well as geopolitical jitters carries the potential to undermine occasional upside momentum in RUB.

USD/RUB levels to watch

At the moment the pair is advancing 0.07% at 65.99 and a breakout of 66.16 (55-day SMA) would open the door to 66.41 (200-day SMA) and then 67.16 (high Feb.14). On the flip side, the initial support emerges at 65.80 (10-day SMA) followed by 65.51 (low Mar.5) and finally 65.16 (2019 low Jan.31).

Share: Feed news

Information on these pages contains forward-looking statements that involve risks and uncertainties. Markets and instruments profiled on this page are for informational purposes only and should not in any way come across as a recommendation to buy or sell in these assets. You should do your own thorough research before making any investment decisions. FXStreet does not in any way guarantee that this information is free from mistakes, errors, or material misstatements. It also does not guarantee that this information is of a timely nature. Investing in Open Markets involves a great deal of risk, including the loss of all or a portion of your investment, as well as emotional distress. All risks, losses and costs associated with investing, including total loss of principal, are your responsibility. The views and opinions expressed in this article are those of the authors and do not necessarily reflect the official policy or position of FXStreet nor its advertisers. The author will not be held responsible for information that is found at the end of links posted on this page.

If not otherwise explicitly mentioned in the body of the article, at the time of writing, the author has no position in any stock mentioned in this article and no business relationship with any company mentioned. The author has not received compensation for writing this article, other than from FXStreet.

FXStreet and the author do not provide personalized recommendations. The author makes no representations as to the accuracy, completeness, or suitability of this information. FXStreet and the author will not be liable for any errors, omissions or any losses, injuries or damages arising from this information and its display or use. Errors and omissions excepted.

The author and FXStreet are not registered investment advisors and nothing in this article is intended to be investment advice.

Recommended content


Recommended content

Editors’ Picks

EUR/USD clings to small gains above 1.0700 ahead of data

EUR/USD clings to small gains above 1.0700 ahead of data

EUR/USD trades marginally higher on the day above 1.0700 on Tuesday after EU inflation data for April came in slightly stronger than expected. Market focus shifts to mid-tier US data ahead of the Fed's policy announcements on Wednesday.

EUR/USD News

GBP/USD recovers to 1.2550 despite US Dollar strength

GBP/USD recovers to 1.2550 despite US Dollar strength

GBP/USD is recovering losses to trade near 1.2550 in the European session on Tuesday. The pair rebounds despite a cautious risk tone and broad US Dollar strength. Investors await macroeconomic data releases from the US.

GBP/USD News

Gold extends daily slide toward $2,310 ahead of US data

Gold extends daily slide toward $2,310 ahead of US data

Gold stays under bearish pressure and declines toward $2,310 on Tuesday. The benchmark 10-year US Treasury bond yield holds steady at around 4.6% ahead of US data, making it difficult for XAU/USD to stage a rebound.

Gold News

XRP hovers above $0.51 as Ripple motion to strike new expert materials receives SEC response

XRP hovers above $0.51 as Ripple motion to strike new expert materials receives SEC response

Ripple (XRP) trades broadly sideways on Tuesday after closing above $0.51 on Monday as the payment firm’s legal battle against the US Securities and Exchange Commission (SEC) persists.

Read more

Eurozone inflation stable as the outlook on prices gets increasingly muddied

Eurozone inflation stable as the outlook on prices gets increasingly muddied

Eurozone headline inflation remains stable at 2.4%. With higher energy prices and improving domestic demand, questions about the direction of inflation become louder.

Read more

Forex MAJORS

Cryptocurrencies

Signatures