USD/NOK dives on weak NFP figures from April
- US NFP increased by 175K in April, below expectations of 243K, following March’s revised increase of 315K.
- Unemployment rose slightly to 3.9% while wage inflation decelerated.
- The odds of a cut in September by the Fed rose significantly.

The USD/NOK pair is trading at 10.861, exhibiting a decline of 1.19% on Friday’s session. The USD faced downward pressure as markets are now betting on higher chances of a rate cut by the Federal Reserve (Fed) in September, following the report of weak Nonfarm Payrolls.
April's NFP report from the US showed a gain of 175K jobs, which was significantly below the market expectation of 243K and a decrease from March's revised figure of 315 K. This slowdown in job growth, combined with the slight rise in the unemployment rate from 3.8% to 3.9%, points towards a cooling labor market. Moreover, the wage inflation rate also dipped from 4.1% to 3.9% annually, suggesting softer wage pressures, which can influence the Federal Reserve's approach to monetary policy. The report's overall outcome, reflecting a deceleration in several key employment metrics, highlights a potentially weakening economic momentum.
This supports a more cautious monetary policy approach, aligning with the Federal Reserve's recent moves towards policy normalization and possibly setting the stage for a first cut in September which according to the CME FedWatch tool, increased above 50%.
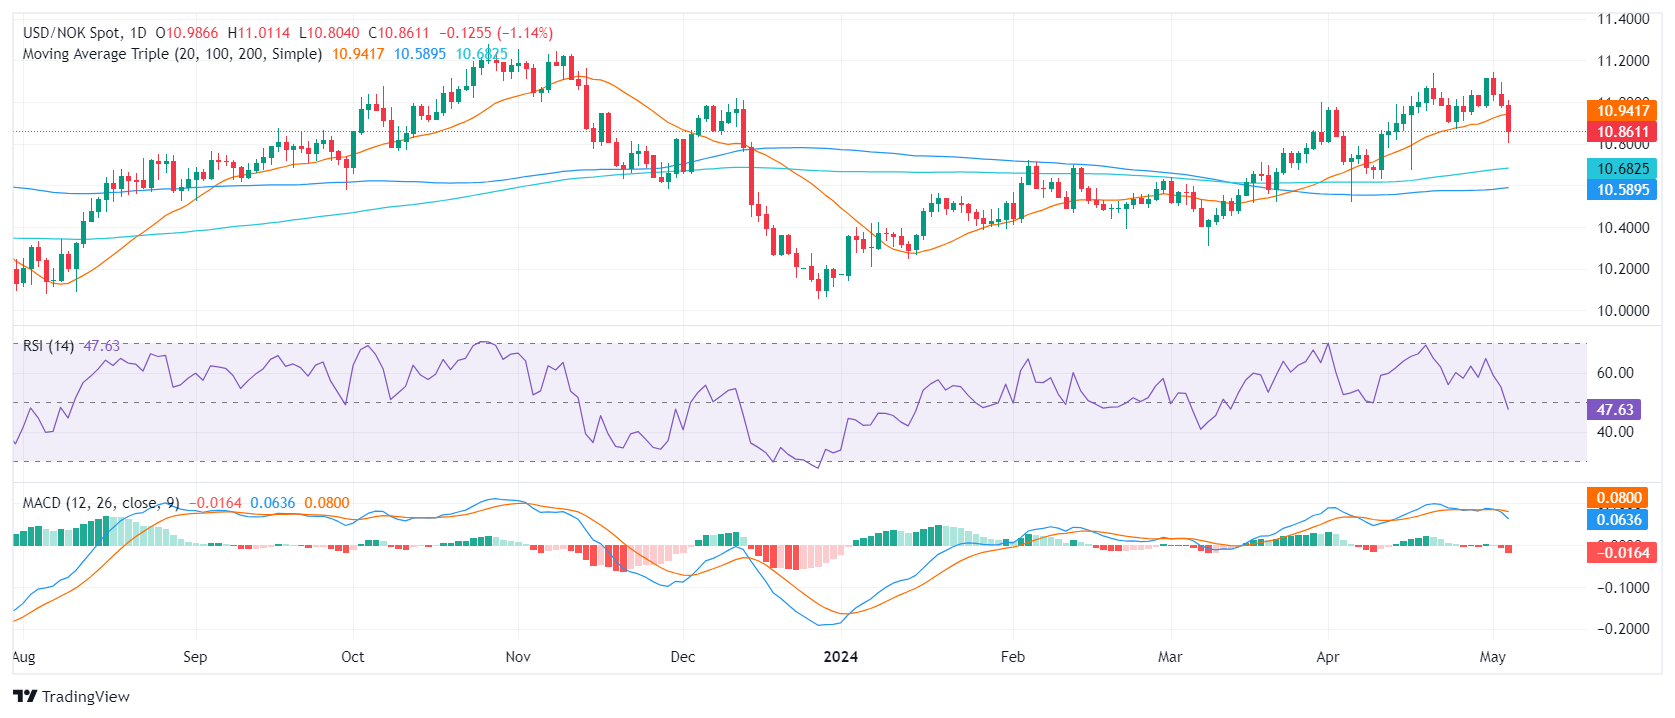
USD/NOK technical analysis
On the daily chart, the Relative Strength Index (RSI) for the USD/NOK pair has moved into negative territory. The indicator was trending positively, nearing overbought conditions, but then reversed to bearish, signaling a tendency for a sell-off. Concurrently, the Moving Average Convergence Divergence (MACD) histogram prints red bars, confirming the presence of strong selling pressure.
Analyzing the broader outlook, it's crucial to note the USD/NOK has made significant strides today, dipping below its 20-day Simple Moving Average (SMA). However, the pair remains firmly above the 100-day and 200-day SMAs. This reveals a potentially bearish short-term trend but confirms the bullish long-term position of the USD/NOK.
USD/NOK daily chart
Author

Patricio Martín
FXStreet
Patricio is an economist from Argentina passionate about global finance and understanding the daily movements of the markets.


