|

USD/MXN tests 22.50 after earthquake hits Mexico

  • A 7.5-magnitude earthquake centered in Oaxaca hit Mexico, no serious damage was reported.
  • USD/MXN rose modestly, to test 22.50 but remains below.

The USD/MXN pair rose to 22.50 after an earthquake hit Mexico. As of writing, it trades at 22.45, flat for the day. Earlier on Tuesday, it peaked at 22.67, and then bottomed at 22.28, the lowest since last Thursday.

No severe damage so far, MXN steady

Mexican assets remained relatively steady after a 7.4 earthquake shook Mexico a few hours ago. The epicenter is near the city of Oaxaca. No serious damage to infrastructure or injuries have been reported.

The USD/MXN moved modestly higher and pulled back, holding practically flat for the American session. The Mexican peso is marginally up versus the US dollar.

Most emerging market currencies are up versus the greenback on Tuesday. The US dollar fell across the board amid risk appetite.

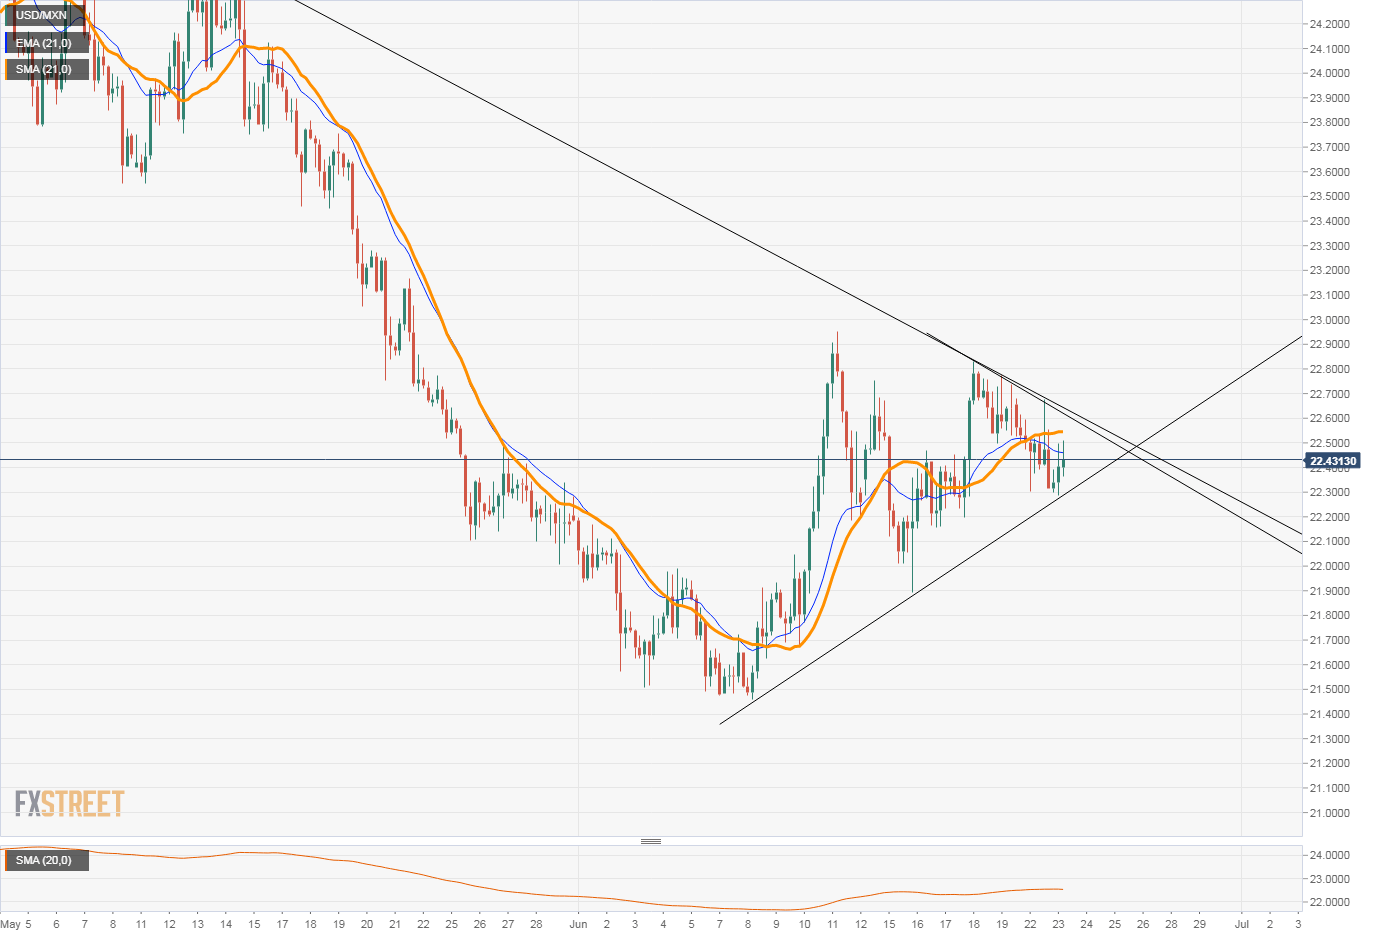
USD/MXN technical analysis  

The 4-hour chart shows USD/MXN moving above an uptrend line from June lows but facing some bearish pressure in the short-term. In order the clear the way to more gains, the pair needs to break above 22.60. A consolidation above would likely be followed by a test of 23.00.

Ahead of the next session, while under 22.50, the negative bias will prevail. A firm break below 22.30 could trigger more losses, with an immediate target at 22.10 and then 21.98.

USDMXN

USD/MXN

Overview
Today last price22.4286
Today Daily Change-0.0758
Today Daily Change %-0.34
Today daily open22.5044
 
Trends
Daily SMA2022.1538
Daily SMA5023.2338
Daily SMA10022.2776
Daily SMA20020.7238
 
Levels
Previous Daily High22.7356
Previous Daily Low22.3032
Previous Weekly High22.829
Previous Weekly Low21.8925
Previous Monthly High24.8895
Previous Monthly Low22.0047
Daily Fibonacci 38.2%22.4684
Daily Fibonacci 61.8%22.5704
Daily Pivot Point S122.2932
Daily Pivot Point S222.082
Daily Pivot Point S321.8608
Daily Pivot Point R122.7256
Daily Pivot Point R222.9468
Daily Pivot Point R323.158

Author

Matías Salord

Matías started in financial markets in 2008, after graduating in Economics. He was trained in chart analysis and then became an educator. He also studied Journalism. He started writing analyses for specialized websites before joining FXStreet.

More from Matías Salord
Share:

Editor's Picks

EUR/USD tests nine-day EMA support near 1.1850

EUR/USD inches lower during the Asian hours on Monday, trading around 1.1870 at the time of writing. The 14-day Relative Strength Index momentum indicator at 56 stays above the midline, confirming improving momentum. RSI has cooled from prior overbought readings but stabilizes above 50, suggesting dips could stay limited before buyers reassert control.

GBP/USD flat lines as traders await key UK macro data and FOMC minutes

The GBP/USD pair kicks off a new week on a subdued note and oscillates in a narrow range, just below mid-1.3600s, during the Asian session. Moreover, the mixed fundamental backdrop warrants some caution for aggressive traders as the market focus now shifts to this week's important releases from the UK and the US.

Gold slides below $5,000 amid USD uptick and positive risk tone; downside seems limited

Gold attracts fresh sellers at the start of a new week and reverses a part of Friday's strong move up of over $150 from sub-$4,900 levels. The commodity slides back below the $5,000 psychological mark during the Asian session, though the downside potential seems limited amid a combination of supporting factors.

Bitcoin, Ethereum and Ripple consolidate within key ranges as selling pressure eases

Bitcoin and Ethereum prices have been trading sideways within key ranges following the massive correction. Meanwhile, XRP recovers slightly, breaking above the key resistance zone. The top three cryptocurrencies hint at a potential short-term recovery, with momentum indicators showing fading bearish signs.

Global inflation watch: Signs of cooling services inflation

Realized inflation landed close to expectations in January, as negative base effects weighed on the annual rates. Remaining sticky inflation is largely explained by services, while tariff-driven goods inflation remains limited even in the US.

Ripple Price Forecast: XRP potential bottom could be in sight

Ripple edges up above the intraday low of $1.35 at the time of writing on Friday amid mixed price actions across the crypto market. The remittance token failed to hold support at $1.40 the previous day, reflecting risk-off sentiment amid a decline in retail and institutional sentiment.