|

USD/MXN rises on risk aversion, as US Treasury yields surged

  • USD/MXN rebounds from 20-day EMA, trading higher despite Wall Street’s positive sentiment.
  • China’s real estate troubles, starting with Evergrande, now impact Country Garde, intensifying global concerns.
  • Upcoming US Retail sales and FOMC minutes eyed, while a light Mexican docket leaves traders tuned to USD dynamics.

USD/MXN began the session positively and bounced off the 20-day Exponential Moving Average (EMA) at 17.0040, even though market sentiment improved, as shown by Wall Street turning green. The USD/MXN is trading at 17.0685m, post gains of 0.42%.

Mexican Peso feels the heat as China’s real estate crisis and US economic indicators steer the market

US equities trade mixed during the North American session, while the Mexican Peso (MXN) gets battered on a risk-off impulse that spurred outflows from the emerging market currency towards the US Dollar (USD), as portrayed by the USD/MXN exchange rate. A jump in US Treasury bond yields underpinned the Greenback after the 10-year benchmark note rate touched a multi-year high of 4.20%.

China’s real estate woes, which initially involved Evergrande in 2021, spilled over its largest private developer Country Garde, which failed to pay its bond interest last week. Real estate in China has suffered tumbling sales as tight liquidity conditions triggered a series of defaults.

Aside from this, the US economic docket would reveal Retail sales for July, estimated to show consumers’ resilience, and Fed speakers on Tuesday. By Wednesday, the release of the latest Federal Open Market Committee (FOMC) minutes could shed light on the Federal Reserve’s (Fed) forward path. At the same time, Industrial Production is estimated to print gains.

Across the border, the Mexican docket is light. That would leave traders adrift to US Dollar dynamics and market sentiment. A risk-on is USD/MXN negative, while risk aversion could pave the way for further USD/MXN upside.

USD/MXN Price Analysis: Technical outlook
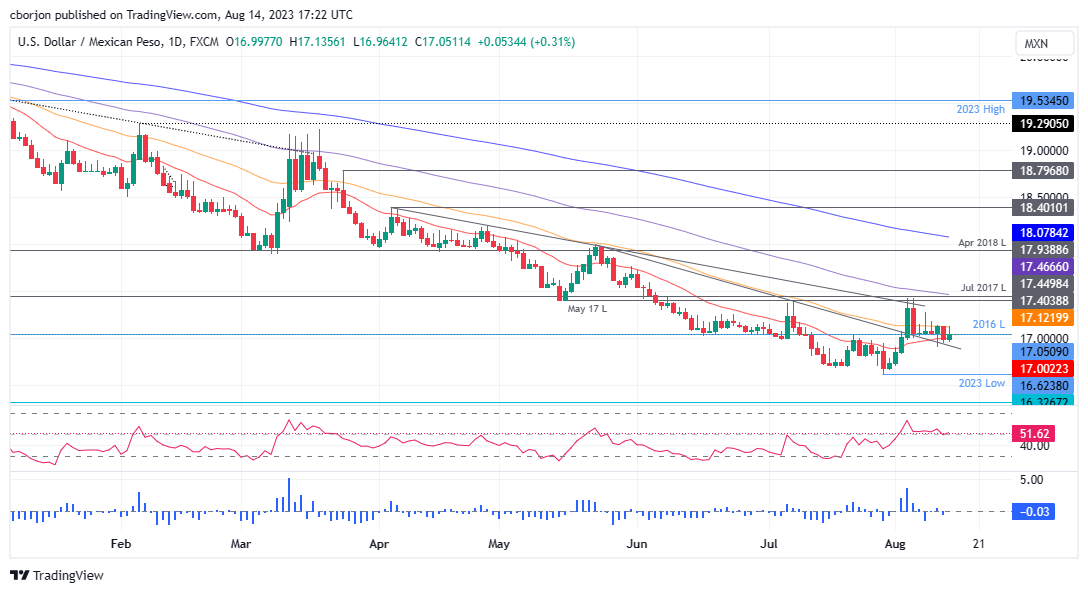
USD/MXN Daily chart

The USD/MXN daily chart portrays the pair as neutral to downward biased, but buyers stepping in around the day’s low opened the door for a recovery above the psychological 17.0000 figure. Of note, the Relative Strength Index (RSI) turned bullish, suggesting that the USD/MXN could be bottoming at around the 16.60-17.00 range, opening the door for further upside. USD/MXN buyers can gain tracti9on above the May 17 low of 17.4038, followed by the 100-day EMA at 17.4671, after reclaiming the 50-day EMA at 17.1228.

USD/MXN

Overview
Today last price17.0521
Today Daily Change0.0497
Today Daily Change %0.29
Today daily open17.0024
 
Trends
Daily SMA2016.9344
Daily SMA5017.0559
Daily SMA10017.4834
Daily SMA20018.2501
 
Levels
Previous Daily High17.1384
Previous Daily Low16.9515
Previous Weekly High17.2852
Previous Weekly Low16.9101
Previous Monthly High17.3957
Previous Monthly Low16.6258
Daily Fibonacci 38.2%17.0229
Daily Fibonacci 61.8%17.067
Daily Pivot Point S116.9232
Daily Pivot Point S216.8439
Daily Pivot Point S316.7362
Daily Pivot Point R117.1101
Daily Pivot Point R217.2177
Daily Pivot Point R317.297

Author

Christian Borjon Valencia

Markets analyst, news editor, and trading instructor with over 14 years of experience across FX, commodities, US equity indices, and global macro markets.


More from Christian Borjon Valencia
Share:

Editor's Picks

AUD/USD holds firm near 0.7000 after Chinese inflation, trade data

AUD/USD stays firm near 0.7000 in Wednesday’s Asian session, picking up some bids after China's mixed inflation and upbeat trade data. CPI rose less than expected in September, while PPI inflation picked up. Meanwhile, the Chinese trade surplus unexpectedly widened in September. The pair remains underpinned by a broadly subdued US Dollar, despite the Middle East escalation, as focus remains on US CPI data.

USD/JPY consolidates near 158.50; looks to US CPI for fresh impetus

USD/JPY stays range-bound near 158.50 in the Asian session on Wednesday, with looming intervention risks supporting the Japanese Yen and capping upside amid a softer US Dollar. However, geopolitical uncertainties act as a tailwind for the safe-haven USD and the pair. Traders also seem hesitant ahead of the release of the latest US inflation figures.

Gold drifts lower with US CPI, Fed speakers in focus

Gold extends losses on Wednesday, despite the lower US Treasury yields, with investors looking from the sidelines ahead of the release of September’s US Consumer Price Index report and speeches from Federal Reserve officials due later in the day. The XAU/USD pair has retreated below the $4,150 level after rejection at the $4,200 area on Monday, with technical indicators showing building bearish momentum.

Bitcoin eyes $85,000; ETH holds support, XRP stabilizes
Bitcoin (BTC), Ethereum (ETH), and Ripple (XRP) show signs of recovery on Wednesday as buyers try to regain control after their recent market weakness. BTC extends its rebound toward the $85,000 resistance, while ETH and XRP find support around key levels.
US CPI data expected to rise in September as markets reassess Fed rate outlook

The US Bureau of Labor Statistics will publish the September Consumer Price Index (CPI) data on Wednesday. The report is expected to show a further increase in headline prices and a small uptick in annual core inflation. Any divergence from analysts’ estimates could influence the Federal Reserve’s policy outlook and impact the US Dollar’s valuation.

Has Bitcoin really escaped the macro forces it was built to fight?
Over 17 years ago, Satoshi Nakamoto designed Bitcoin (BTC) on the back of a global financial crisis as an alternative to the global monetary system outside the control of central banks, governments and traditional intermediaries. This raises a key question: has Bitcoin really become independent of the macroeconomic forces it was built to challenge?