|

USD/MXN Price Analysis: Tests $18.65 as a falling wedge emerges

  • Long-term, the USD/MXN remains downward biased, as it got rejected at the 50-hour EMA.
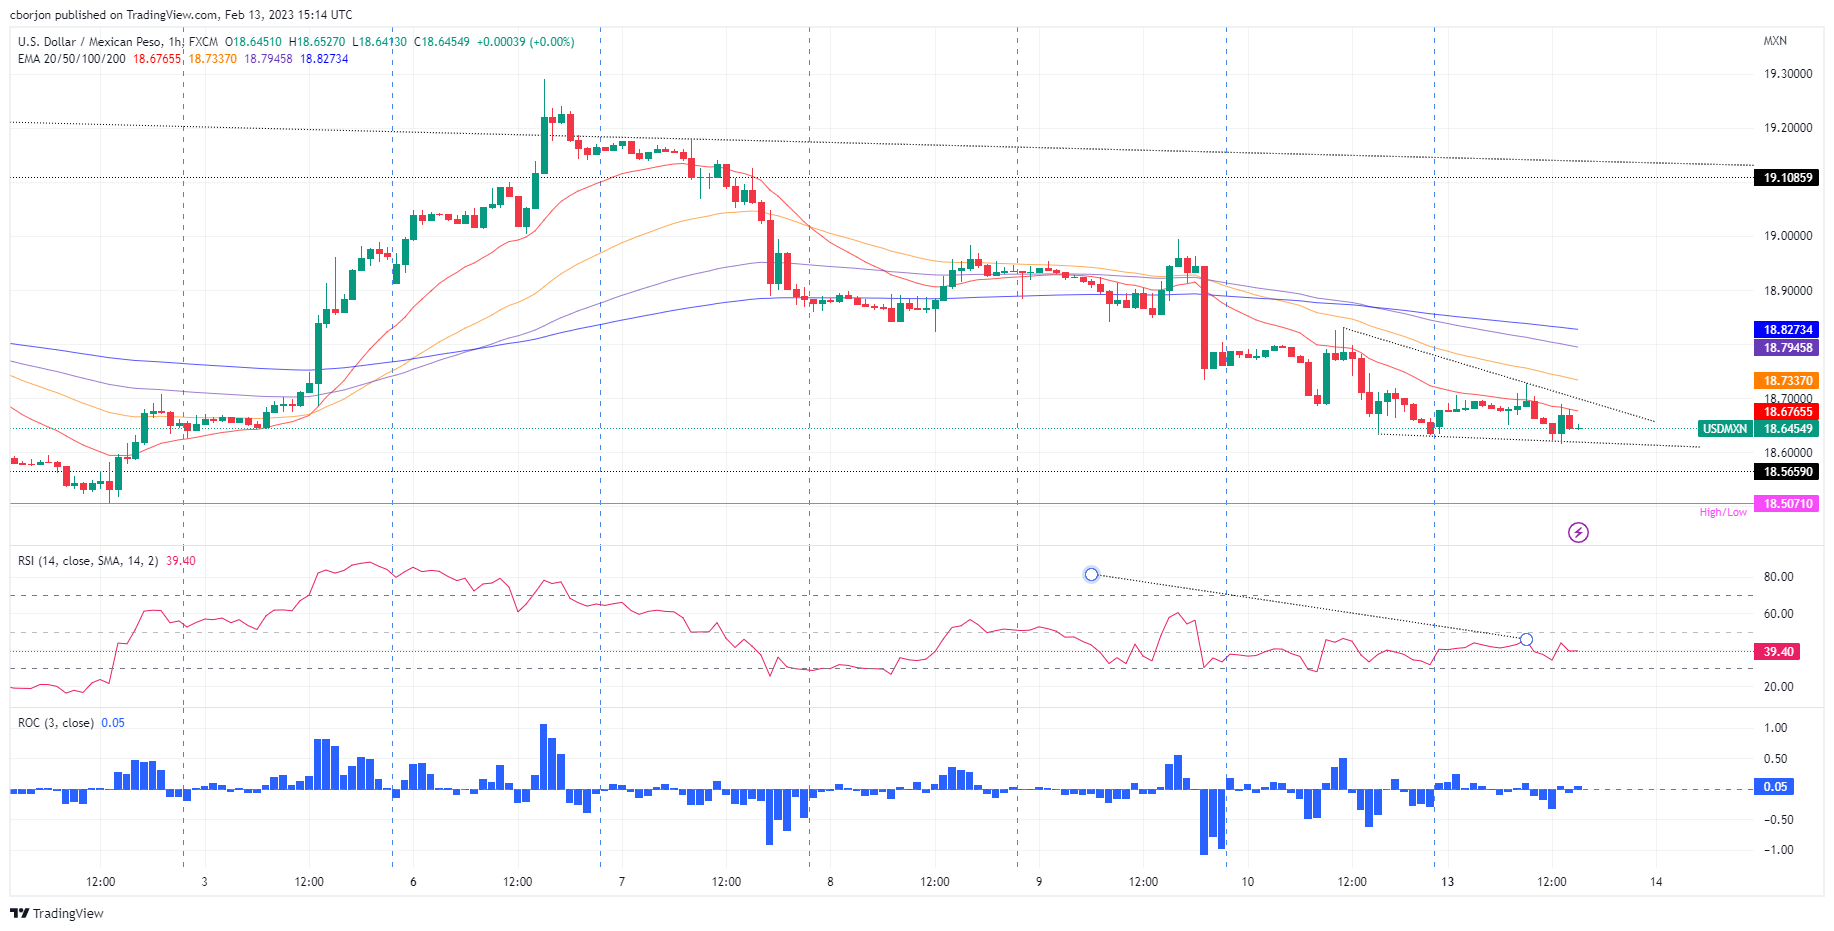
  • USD/MXN, on an intraday basis, formed a falling wedge, suggesting that buyers are gathering momentum.

The USD/MXN recovered some ground on Monday after last week’s Banxico decision to raise rates by 50 basis points (bps) interest rates to the 11% threshold spurred a bid in the Mexican Peso (MXN). At the time of writing, the USD/MXN exchanges hands at 18.6517, above its opening price by a slight margin of 0.03%.

From a daily chart perspective, the USD/MXN is still downward biased, as the daily moving averages (MAs) remain above the spot price. Even though the USD/MXN paired some of last Friday’s losses, the USD/MXN pair remains under selling pressure, and it could shift neutral if the USD/MXN breaks resistance at the 50-day Exponential Moving Average (EMA) at 19.0805.

Oscillators like the Relative Strength Index (RSI) point downwards and in bearish territory, so further downside is expected.

On an intraday basis, the USD/MXN 1-hour chart suggests the pair might consolidate in the 18.50-19.00 area, unable to crack support/resistance levels.

A falling wedge is forming as the pair bottoms at around the $18.60 area, which would exacerbate an upward move in the USD/MXN, though there are some key resistance levels that buyers need to battle, to lift the USD/MXN exchange rate towards $19.00.

A break above the 20-period Exponential Moving Average (EMA) at 18.6768 would send the USD/MXN pair toward 18.7336., which, once cleared, would open the door for further gains toward the 100-EMA at 18.7945 and the 200-EMA at 18.8273.

USD/MXN 1-Hour chart

USD/MXN Key technical levels

USD/MXN

Overview
Today last price18.6457
Today Daily Change-0.0119
Today Daily Change %-0.06
Today daily open18.6576
 
Trends
Daily SMA2018.8225
Daily SMA5019.2093
Daily SMA10019.4759
Daily SMA20019.8051
 
Levels
Previous Daily High18.8318
Previous Daily Low18.639
Previous Weekly High19.2901
Previous Weekly Low18.639
Previous Monthly High19.5361
Previous Monthly Low18.5663
Daily Fibonacci 38.2%18.7127
Daily Fibonacci 61.8%18.7582
Daily Pivot Point S118.5871
Daily Pivot Point S218.5167
Daily Pivot Point S318.3943
Daily Pivot Point R118.7799
Daily Pivot Point R218.9023
Daily Pivot Point R318.9727

Author

Christian Borjon Valencia

Christian Borjon began his career as a retail trader in 2010, mainly focused on technical analysis and strategies around it. He started as a swing trader, as he used to work in another industry unrelated to the financial markets.

More from Christian Borjon Valencia
Share:

Markets move fast. We move first.

Orange Juice Newsletter brings you expert driven insights - not headlines. Every day on your inbox.

By subscribing you agree to our Terms and conditions.

Editor's Picks

EUR/USD recovers to 1.1750 region as 2025 draws to a close

Following the bearish action seen in the European session on Wednesday, EUR/USD regains its traction and recovery to the 1.1750 region. Nevertheless, the pair's volatility remains low as trading conditions thin out on the last day of the year.

GBP/USD stays weak near 1.3450 on modest USD recovery

GBP/USD remains under modest beairsh pressure and fluctuates at around 1.3450 on Wednesday. The US Dollar finds fresh demand due to the end-of-the-year position adjustments, weighing on the pair amid the pre-New Year trading lull. 

Gold retreats to $4,300 area, looks to post monthly gains

Gold stays on the back foot on the last day of 2025 and trades near $4,300, possibly pressured by profit-taking and position adjustments. Nevertheless, XAU/USD remains on track to post gains for December and extend its winning streak into a fifth consecutive month.

Bitcoin, Ethereum and XRP prepare for a potential New Year rebound

Bitcoin, Ethereum, and Ripple are holding steady on Wednesday after recording minor gains on the previous day. Technically, Bitcoin could extend gains within a triangle pattern while Ethereum and Ripple face critical overhead resistance. 

Economic outlook 2026-2027 in advanced countries: Solidity test

After a year marked by global economic resilience and ending on a note of optimism, 2026 looks promising and could be a year of solid economic performance. In our baseline scenario, we expect most of the supportive factors at work in 2025 to continue to play a role in 2026.

Crypto market outlook for 2026

Year 2025 was volatile, as crypto often is.  Among positive catalysts were favourable regulatory changes in the U.S., rise of Digital Asset Treasuries (DAT), adoption of AI and tokenization of Real-World-Assets (RWA).