|

USD/MXN Price Analysis: Testing the 200-DMA as bears eye 20.1500

  • The Mexican peso posts its biggest weekly gain, 2.39%.
  • Market sentiment is mixed; the greenback rallies but falls vs. risk-sensitive currencies.
  • USD/MXN Price Forecast: Neutral, but a daily close under the 200-DMA would expose the pair under downward pressure.

The Mexican peso extends its weekly rally gains 2.39% vs. the US Dollar, despite a mixed market mood, on Friday’s New York session. At the time of writing, the USD/MXN is trading at 20.4218.

European and US equity markets fluctuate between gainers and losers. At the same time, the greenback remains bid, with the US Dollar Index, a gauge of the greenback’s value against a basket of peers, is up 0.34%, sitting at 98.31, faltering of weighing on the USD/MXN pair.

Overnight, the USD/MXN pair was subdued in the 20.50 area, without much movement, though as the North American session began, the pair drooped through European session lows around 20.4646, towards lows 20.40s area.

USD/MXN Price Forecast: Technical outlook

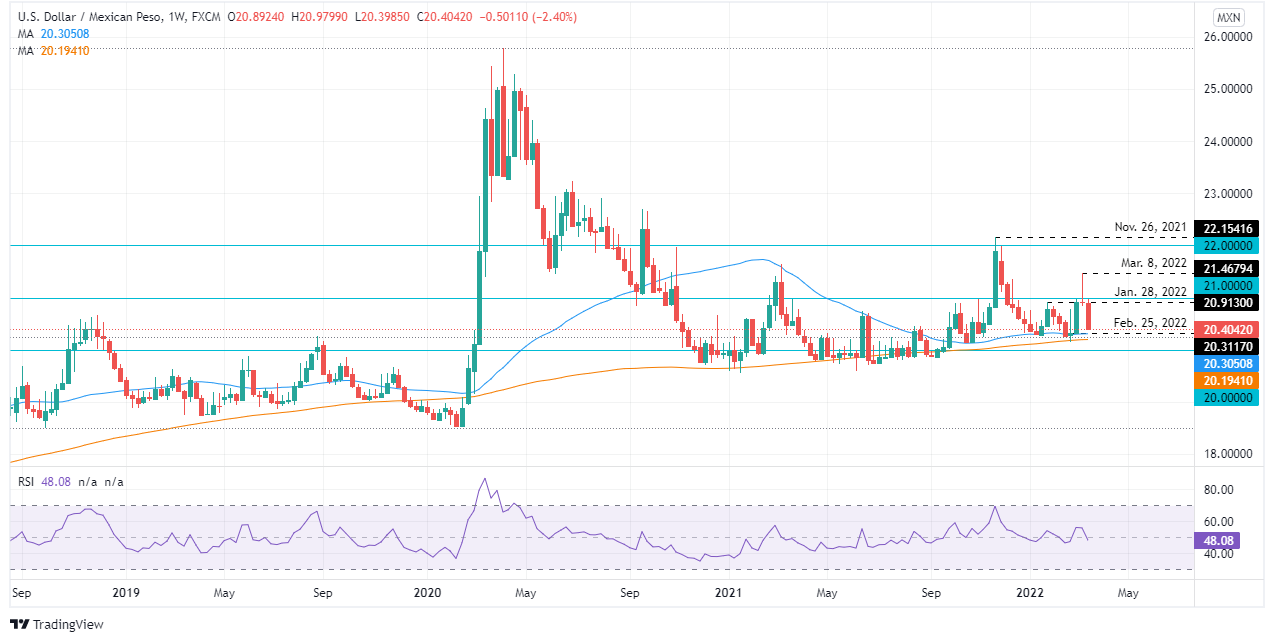
The USD/MXN is neutral biased and is probing the 200-day moving average (DMA), sitting at 20.4125. The Relative Strength Index (RSI) is at 41.50, beneath the 50-midline, aiming lower, suggesting the USD/MXN might be moving towards the February 23 YTD low at 20.1558, but it would find some hurdles on the way south.

If that scenario plays out, the USD/MXN’s first support would be the 200-DMA. Breach of the latter would expose 20.3117, which once cleared would pave the way towards February 23 daily low at 20.1558.

Upwards, the USD/MXX first resistance would be the 20.50 mark. A decisive break would expose the 50-DMA at 20.5667, followed by January 28 daily high at 20.9130 and then 21.00.

USD/MXN

Overview
Today last price20.4051
Today Daily Change-0.1173
Today Daily Change %-0.57
Today daily open20.5224
 
Trends
Daily SMA2020.6893
Daily SMA5020.5778
Daily SMA10020.7145
Daily SMA20020.4211
 
Levels
Previous Daily High20.6666
Previous Daily Low20.4988
Previous Weekly High21.4682
Previous Weekly Low20.8467
Previous Monthly High20.7904
Previous Monthly Low20.1571
Daily Fibonacci 38.2%20.5629
Daily Fibonacci 61.8%20.6025
Daily Pivot Point S120.4586
Daily Pivot Point S220.3948
Daily Pivot Point S320.2908
Daily Pivot Point R120.6264
Daily Pivot Point R220.7304
Daily Pivot Point R320.7942

Author

Christian Borjon Valencia

Christian Borjon began his career as a retail trader in 2010, mainly focused on technical analysis and strategies around it. He started as a swing trader, as he used to work in another industry unrelated to the financial markets.

More from Christian Borjon Valencia
Share:

Markets move fast. We move first.

Orange Juice Newsletter brings you expert driven insights - not headlines. Every day on your inbox.

By subscribing you agree to our Terms and conditions.

Editor's Picks

EUR/USD moves sideways below 1.1800 on Christmas Eve

EUR/USD struggles to find direction and trades in a narrow channel below 1.1800 after posting gains for two consecutive days. Bond and stock markets in the US will open at the usual time and close early on Christmas Eve, allowing the trading action to remain subdued. 

GBP/USD keeps range around 1.3500 amid quiet markets

GBP/USD keeps its range trade intact at around 1.3500 on Wednesday. The Pound Sterling holds the upper hand over the US Dollar amid pre-Christmas light trading as traders move to the sidelines heading into the holiday season. 

Gold retreats from record highs, trades below $4,500

Gold retreats after setting a new record-high above $4,520 earlier in the day and trades in a tight range below $4,500 as trading volumes thin out ahead of the Christmas break. The US Dollar selling bias remains unabated on the back of dovish Fed expectations, which continues to act as a tailwind for the bullion amid persistent geopolitical risks.

Bitcoin slips below $87,000 as ETF outflows intensify, whale participation declines

Bitcoin price continues to trade around $86,770 on Wednesday, after failing to break above the $90,000 resistance. US-listed spot ETFs record an outflow of $188.64 million on Tuesday, marking the fourth consecutive day of withdrawals.

Economic outlook 2026-2027 in advanced countries: Solidity test

After a year marked by global economic resilience and ending on a note of optimism, 2026 looks promising and could be a year of solid economic performance. In our baseline scenario, we expect most of the supportive factors at work in 2025 to continue to play a role in 2026.

Avalanche struggles near $12 as Grayscale files updated form for ETF

Avalanche trades close to $12 by press time on Wednesday, extending the nearly 2% drop from the previous day. Grayscale filed an updated form to convert its Avalanche-focused Trust into an ETF with the US Securities and Exchange Commission.