|

USD/MXN Price Analysis: Retakes 19.00 mark, eyes 100-day SMA/38.2% Fibo. confluence hurdle

  • USD/MXN gains traction for the fourth straight day and trades near a one-month high set on Monday.
  • Bulls now await a move beyond the 100-day SMA and 38.2% Fibo. confluence before placing fresh bets.
  • Weakness back below the 18.35 horizontal support is needed to offset the near-term positive outlook.

The USD/MXN pair attracts some buying for the fourth successive day on Tuesday and maintains its bid tone through the early part of the European session. The pair steadily climbs back above the 19.00 mark and remains well within the striking distance of over a one-month top touched on Monday.

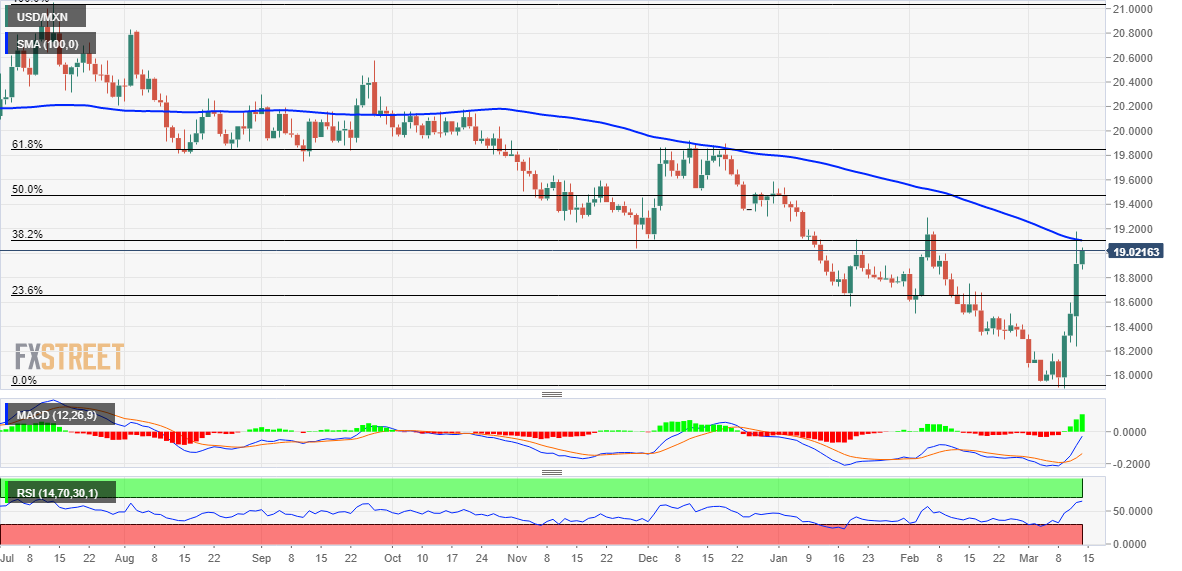
Given that oscillators on the daily chart are holding in the positive territory and are still far from being in the overbought zone, the technical setup favours bullish traders. That said, the overnight failures to find acceptance above the 100-day Simple Moving Average (SMA) and the 38.2% Fibonacci retracement level of the July 2022-March 2023 downfall warrant caution. This makes it prudent to wait for a convincing break through the said confluence barrier before positioning for any further appreciating move.

The USD/MXN pair could then aim to surpass the February monthly swing high, around the 19.30 region and climb to the 50% Fibo. level, around the mid-19.00s. The upward trajectory could get extended towards testing the 19.75-19.80 horizontal support breakpoint, which now coincides with the 61.8% Fibo. level and should act as a pivotal point. A convincing breakthrough will set the stage for an extension of the recent strong recovery move from sub-18.00 levels, or a multi-year low touched last week.

On the flip side, the 23.6% Fibo. level, around the 18.65 area, now seems to protect the immediate downside ahead of the 18.35 horizontal support. Sustained weakness below will suggest that a one-week-old uptrend has run out of steam and make the USD/MXN pair vulnerable to retesting the 18.00-17.90 support zone.

USD/MXN daily chart

fxsoriginal

Key levels to watch

USD/MXN

Overview
Today last price19.0057
Today Daily Change0.0937
Today Daily Change %0.50
Today daily open18.912
 
Trends
Daily SMA2018.3351
Daily SMA5018.6751
Daily SMA10019.113
Daily SMA20019.6429
 
Levels
Previous Daily High19.1812
Previous Daily Low18.2397
Previous Weekly High18.5957
Previous Weekly Low17.8977
Previous Monthly High19.2901
Previous Monthly Low18.2954
Daily Fibonacci 38.2%18.8216
Daily Fibonacci 61.8%18.5994
Daily Pivot Point S118.3741
Daily Pivot Point S217.8361
Daily Pivot Point S317.4325
Daily Pivot Point R119.3156
Daily Pivot Point R219.7192
Daily Pivot Point R320.2571

Author

Haresh Menghani

Haresh Menghani is a detail-oriented professional with 10+ years of extensive experience in analysing the global financial markets.

More from Haresh Menghani
Share:

Markets move fast. We move first.

Orange Juice Newsletter brings you expert driven insights - not headlines. Every day on your inbox.

By subscribing you agree to our Terms and conditions.

Editor's Picks

EUR/USD recovers to 1.1750 region as 2025 draws to a close

Following the bearish action seen in the European session on Wednesday, EUR/USD regains its traction and recovery to the 1.1750 region. Nevertheless, the pair's volatility remains low as trading conditions thin out on the last day of the year.

GBP/USD stays weak near 1.3450 on modest USD recovery

GBP/USD remains under modest beairsh pressure and fluctuates at around 1.3450 on Wednesday. The US Dollar finds fresh demand due to the end-of-the-year position adjustments, weighing on the pair amid the pre-New Year trading lull. 

Gold retreats to $4,300 area, looks to post monthly gains

Gold stays on the back foot on the last day of 2025 and trades near $4,300, possibly pressured by profit-taking and position adjustments. Nevertheless, XAU/USD remains on track to post gains for December and extend its winning streak into a fifth consecutive month.

Bitcoin, Ethereum and XRP prepare for a potential New Year rebound

Bitcoin, Ethereum, and Ripple are holding steady on Wednesday after recording minor gains on the previous day. Technically, Bitcoin could extend gains within a triangle pattern while Ethereum and Ripple face critical overhead resistance. 

Economic outlook 2026-2027 in advanced countries: Solidity test

After a year marked by global economic resilience and ending on a note of optimism, 2026 looks promising and could be a year of solid economic performance. In our baseline scenario, we expect most of the supportive factors at work in 2025 to continue to play a role in 2026.

Crypto market outlook for 2026

Year 2025 was volatile, as crypto often is.  Among positive catalysts were favourable regulatory changes in the U.S., rise of Digital Asset Treasuries (DAT), adoption of AI and tokenization of Real-World-Assets (RWA).