|

USD/MXN Price Analysis: Resistance area at 20.15/20 holds after first test

  • USD/MXN fails to break key resistance near 20.20.
  • Break above 20.20 to give momentum to the dollar.
  • Price continues to consolidate around 20.00.

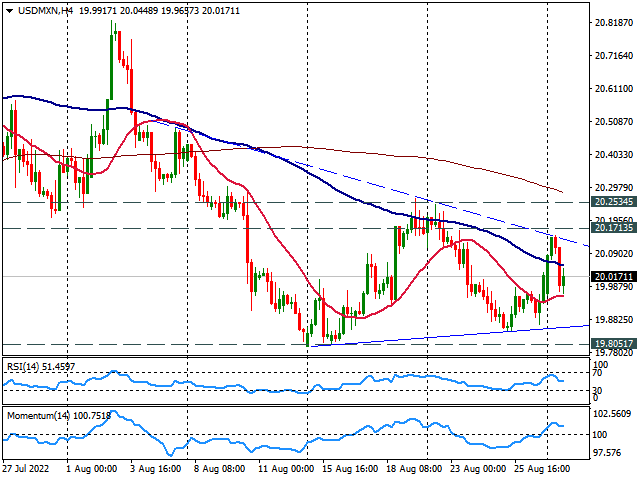
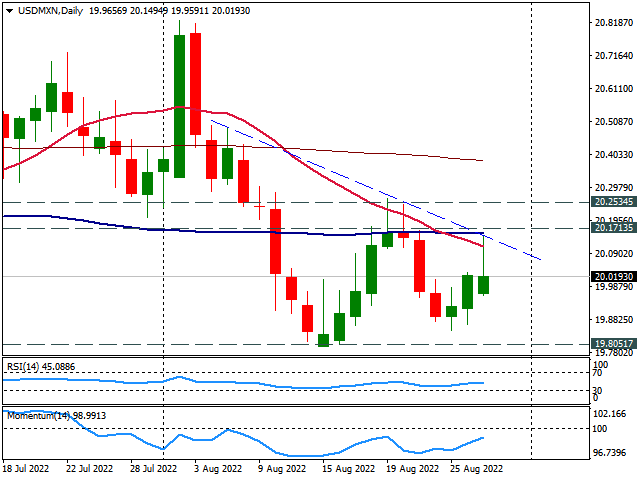
The USD/MXN is flat on Monday as it pulled back after reaching the highest level in almost a week at 20.16. The pair tested a critical resistance area around 20.17, the convergence of a short-term downtrend line and the 20 and 200-day Simple Moving Average.

A break above 20.20 should give momentum to the US Dollar and a close above 20.25 would point to more gains, with the next resistance located at 20.45.

A slide under 19.98 should put the Mexican peso to test the 19.90 support area. A break lower would expose the August low around 19.80, a strong support level that would likely hold, favoring a rebound to 19.90 before a break lower.

On a wider perspective, USD/MXN continues to consolidate around 20.00, moving without a clear direction. With the price under key daily moving average the bias is to the downside with momentum under 100. Although other technical indicators like the RSI are flat around midlines.

USD/MXN 4-hour chart

USD/MXN daily chart 

USD/MXN

Overview
Today last price20.0126
Today Daily Change-0.0132
Today Daily Change %-0.07
Today daily open20.0258
 
Trends
Daily SMA2020.1338
Daily SMA5020.2873
Daily SMA10020.1576
Daily SMA20020.3935
 
Levels
Previous Daily High20.0346
Previous Daily Low19.8686
Previous Weekly High20.2483
Previous Weekly Low19.8495
Previous Monthly High21.0539
Previous Monthly Low20.0921
Daily Fibonacci 38.2%19.9712
Daily Fibonacci 61.8%19.932
Daily Pivot Point S119.9181
Daily Pivot Point S219.8104
Daily Pivot Point S319.7522
Daily Pivot Point R120.0841
Daily Pivot Point R220.1423
Daily Pivot Point R320.25

Author

Matías Salord

Matías started in financial markets in 2008, after graduating in Economics. He was trained in chart analysis and then became an educator. He also studied Journalism. He started writing analyses for specialized websites before joining FXStreet.

More from Matías Salord
Share:

Markets move fast. We move first.

Orange Juice Newsletter brings you expert driven insights - not headlines. Every day on your inbox.

By subscribing you agree to our Terms and conditions.

Editor's Picks

EUR/USD clings to small gains near 1.1750

Following a short-lasting correction in the early European session, EUR/USD regains its traction and clings to moderate gains at around 1.1750 on Monday. Nevertheless, the pair's volatility remains low, with investors awaiting this weeks key data releases from the US and the ECB policy announcements.

GBP/USD edges higher toward 1.3400 ahead of US data and BoE

GBP/USD reverses its direction and advances toward 1.3400 following a drop to the 1.3350 area earlier in the day. The US Dollar struggles to gather recovery momentum as markets await Tuesday's Nonfarm Payrolls data, while the Pound Sterling holds steady ahead of the BoE policy announcements later in the week.

Gold pulls away from session high, holds above $4,300

Gold loses its bullish momentum and retreats below $4,350 after testing this level earlier on Monday. XAU/USD, however, stays in positive territory as the US Dollar remains on the back foot on growing expectations for a dovish Fed policy outlook next year.

Solana consolidates as spot ETF inflows near $1 billion signal institutional dip-buying

Solana price hovers above $131 at the time of writing on Monday, nearing the upper boundary of a falling wedge pattern, awaiting a decisive breakout. On the institutional side, demand for spot Solana Exchange-Traded Funds remained firm, pushing total assets under management to nearly $1 billion since launch. 

Big week ends with big doubts

The S&P 500 continued to push higher yesterday as the US 2-year yield wavered around the 3.50% mark following a Federal Reserve (Fed) rate cut earlier this week that was ultimately perceived as not that hawkish after all. The cut is especially boosting the non-tech pockets of the market.

Solana Price Forecast: SOL consolidates as spot ETF inflows near $1 billion signal institutional dip-buying

Solana (SOL) price hovers above $131 at the time of writing on Monday, nearing the upper boundary of a falling wedge pattern, awaiting a decisive breakout.