|

USD/MXN Price Analysis: Peso sellers attack key support around 17.20 ahead of US, Mexico data

  • USD/MXN prods 15-week-old falling resistance line after a three-day-long winning streak.
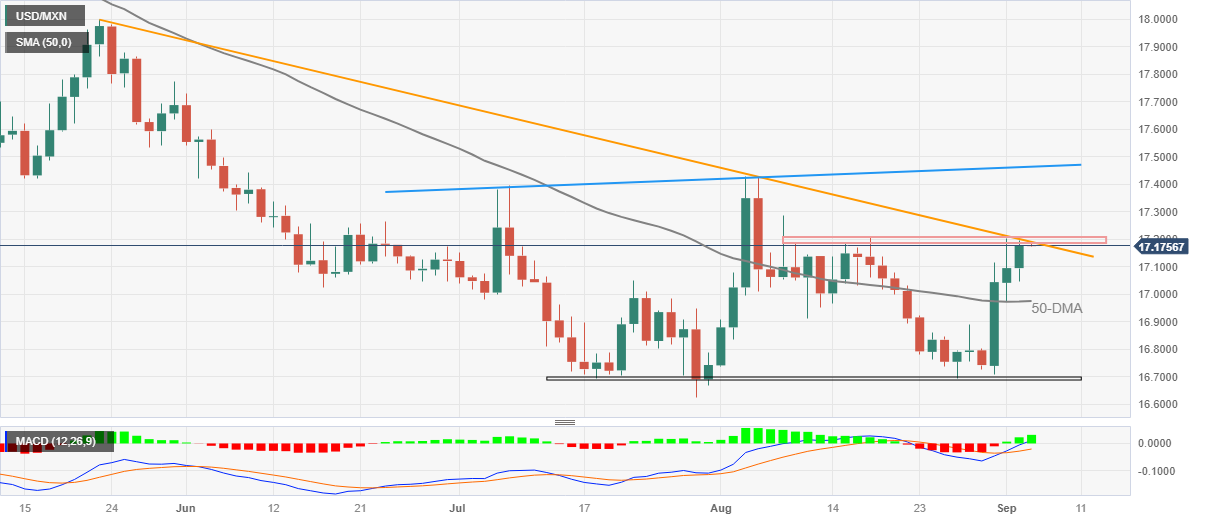
  • Monthly horizontal resistance area adds to the upside filters.
  • Mexican Peso sellers cheer sustained trading beyond 50-DMA, bullish MACD signals.
  • Rising trend line from early July acts as the last defense of Mexican Peso bulls.

USD/MXN bulls attack the key upside hurdle surrounding 17.20, close to 17.17 by the press time of early Tuesday morning in Asia.

The Mexican Peso (MXN) pair rose in the last three consecutive days before poking a downward-sloping resistance line from May 31, close to 17.20 at the latest.

The upside momentum takes clues from the bullish MACD signals and the USD/MXN pair’s ability to stay firmer past the 50-DMA, around 16.97 by the press time.

It’s worth noting, however, that a one-month-old horizontal area adds strength to the 17.18–20 hurdle for the USD/MXN bulls.

Following that, a quick run-up towards the ascending resistance line stretched from early July, surrounding 17.46 at the latest, can’t be ruled out.

On the flip side, the USD/MXN pullback remains elusive unless it stays beyond the 50-DMA support of 16.97. That said, the 17.00 round figure restricts the nearby downside of the quote.

In a case where the Mexican Peso (MXN) pair remains bearish past 16.97, a seven-week-long horizontal area surrounding 16.68–70 will be in the spotlight.

Overall, the USD/MXN pair is likely to remain firmer but the immediate resistance line and the presence of the US Factory Orders for July, as well as Mexican Consumer Confidence for August, test the pair buyers.

USD/MXN: Daily chart

Trend: Limited upside expected

Additional important levels

Overview
Today last price17.1754
Today Daily Change0.0810
Today Daily Change %0.47%
Today daily open17.0944
 
Trends
Daily SMA2016.9814
Daily SMA5016.9721
Daily SMA10017.3048
Daily SMA20018.0648
 
Levels
Previous Daily High17.2025
Previous Daily Low16.9727
Previous Weekly High17.2025
Previous Weekly Low16.6945
Previous Monthly High17.4274
Previous Monthly Low16.6945
Daily Fibonacci 38.2%17.1147
Daily Fibonacci 61.8%17.0605
Daily Pivot Point S116.9773
Daily Pivot Point S216.8601
Daily Pivot Point S316.7474
Daily Pivot Point R117.2071
Daily Pivot Point R217.3197
Daily Pivot Point R317.4369

Author

Anil Panchal

Anil Panchal

FXStreet

Anil Panchal has nearly 15 years of experience in tracking financial markets. With a keen interest in macroeconomics, Anil aptly tracks global news/updates and stays well-informed about the global financial moves and their implications.

More from Anil Panchal
Share:

Markets move fast. We move first.

Orange Juice Newsletter brings you expert driven insights - not headlines. Every day on your inbox.

By subscribing you agree to our Terms and conditions.

Editor's Picks

EUR/USD moves sideways below 1.1800 on Christmas Eve

EUR/USD struggles to find direction and trades in a narrow channel below 1.1800 after posting gains for two consecutive days. Bond and stock markets in the US will open at the usual time and close early on Christmas Eve, allowing the trading action to remain subdued. 

GBP/USD keeps range around 1.3500 amid quiet markets

GBP/USD keeps its range trade intact at around 1.3500 on Wednesday. The Pound Sterling holds the upper hand over the US Dollar amid pre-Christmas light trading as traders move to the sidelines heading into the holiday season. 

Gold retreats from record highs, trades below $4,500

Gold retreats after setting a new record-high above $4,520 earlier in the day and trades in a tight range below $4,500 as trading volumes thin out ahead of the Christmas break. The US Dollar selling bias remains unabated on the back of dovish Fed expectations, which continues to act as a tailwind for the bullion amid persistent geopolitical risks.

Bitcoin slips below $87,000 as ETF outflows intensify, whale participation declines

Bitcoin price continues to trade around $86,770 on Wednesday, after failing to break above the $90,000 resistance. US-listed spot ETFs record an outflow of $188.64 million on Tuesday, marking the fourth consecutive day of withdrawals.

Economic outlook 2026-2027 in advanced countries: Solidity test

After a year marked by global economic resilience and ending on a note of optimism, 2026 looks promising and could be a year of solid economic performance. In our baseline scenario, we expect most of the supportive factors at work in 2025 to continue to play a role in 2026.

Avalanche struggles near $12 as Grayscale files updated form for ETF

Avalanche trades close to $12 by press time on Wednesday, extending the nearly 2% drop from the previous day. Grayscale filed an updated form to convert its Avalanche-focused Trust into an ETF with the US Securities and Exchange Commission.