USD/MXN Price Analysis: Mexican Peso bounces off 200-HMA
- USD/MXN snaps two-day losing streak.
- A short-term falling trend line could question the bounce.
- Weekly horizontal support line adds to the downside rest-point below 200-HMA.
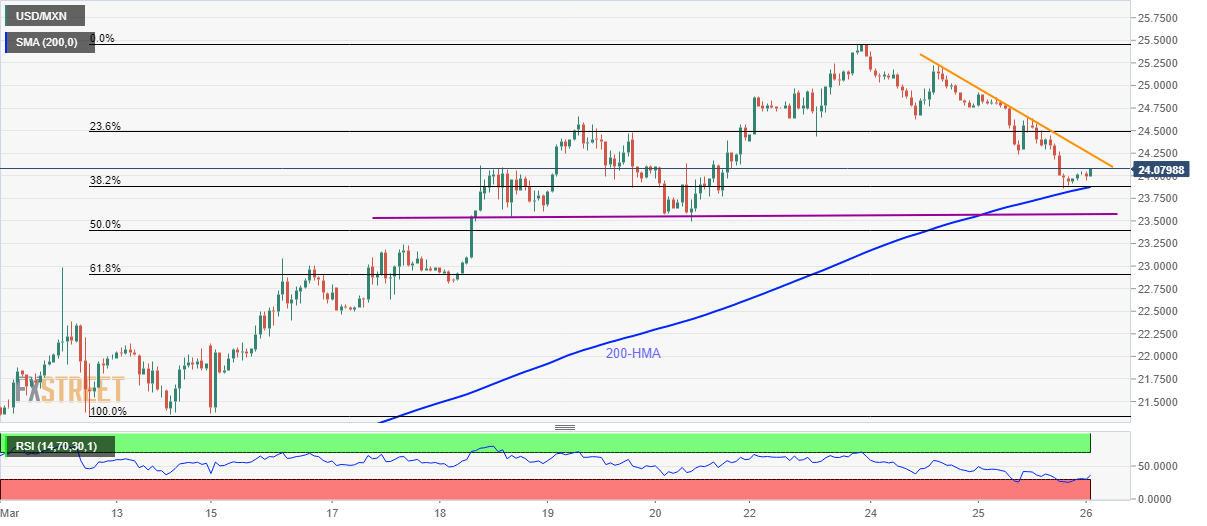
Following its U-turn from 200-HMA and 38.2% Fibonacci retracement of March 12-23 upside, USD/MXN takes the bids near 24.07, up 0.6%, amid the early Thursday.
The pair currently heads to the two-day-old falling resistance line, at 24.25 now, whereas 24.65 and 25.00 could question the bulls afterward.
Should there be a clear upside past-25.00, the recent record high surrounding 25.45 will be challenged.
Alternatively, the pair’s declines below 23.90/85 support confluence, including 200-HMA and 38.2% Fibonacci retracement, may take rest on the weekly horizontal support, around 23.55.
In a case where the bears keep dominating past-23.55, the escalated selling pressure towards the sub-23.00 area can’t be ruled out.
USD/MXN forecast chart
Trend: Pullback expected
Author

Anil Panchal
FXStreet
Anil Panchal has nearly 15 years of experience in tracking financial markets. With a keen interest in macroeconomics, Anil aptly tracks global news/updates and stays well-informed about the global financial moves and their implications.


