|

USD/MXN Price Analysis: Mexican Peso bears retreat from 100-SMA, 18.00 in focus

  • USD/MXN prints mild losses to consolidate the biggest daily jump in three weeks.
  • Failure to cross 100-SMA appears less lucrative for Mexican Peso buyers unless slipping below previous resistance line from early April.
  • 200-SMA, seven-week-long ascending trend line are the key levels to follow clear directions.

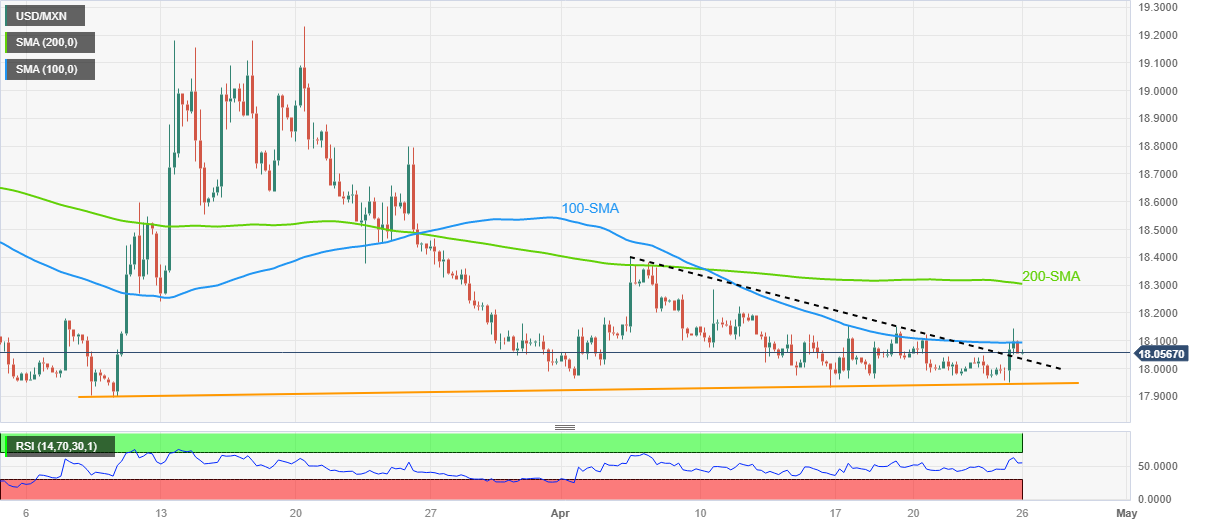
USD/MXN drops to 18.05 as it pares the longest daily run-up in three weeks amid Wednesday’s sluggish morning. In doing so, the Mexican Peso (MXN) pair retreats from a one-week high after snapping a four-day downtrend the previous day.

That said, the 100-SMA hurdle of around 18.10 by the press time guards the immediate recovery of the USD/MXN pair.

However, the pair buyers remain hopeful amid the upbeat RSI (14) line unless the quote defies Tuesday’s break of a three-week-old resistance line, now immediate support near 18.00.

Even if the USD/MXN sellers manage to conquer the 18.00 resistance-turned-support, an upward-sloping support line from early March, close to 17.94 at the latest, becomes crucial for them to break.

Meanwhile, an upside break of the 100-SMA hurdle of 18.10 isn’t an open invitation to the USD/MXN bulls as the 200-SMA level of 18.30 and the monthly high surrounding 18.40 can challenge the USD/MXN bulls afterward.

In a case where the Mexican Peso bears keep the reins past 18.40, the late March swing high of around 18.80 and the 19.00 round figure could lure the traders.

USD/MXN: Four-hour chart

Trend: Limited downside expected

Additional important levels

Overview
Today last price18.0557
Today Daily Change-0.0177
Today Daily Change %-0.10%
Today daily open18.0734
 
Trends
Daily SMA2018.0857
Daily SMA5018.2943
Daily SMA10018.7279
Daily SMA20019.3311
 
Levels
Previous Daily High18.144
Previous Daily Low17.9511
Previous Weekly High18.1542
Previous Weekly Low17.9329
Previous Monthly High19.2324
Previous Monthly Low17.8977
Daily Fibonacci 38.2%18.0703
Daily Fibonacci 61.8%18.0248
Daily Pivot Point S117.9684
Daily Pivot Point S217.8634
Daily Pivot Point S317.7756
Daily Pivot Point R118.1612
Daily Pivot Point R218.249
Daily Pivot Point R318.354

Author

Anil Panchal

Anil Panchal

FXStreet

Anil Panchal has nearly 15 years of experience in tracking financial markets. With a keen interest in macroeconomics, Anil aptly tracks global news/updates and stays well-informed about the global financial moves and their implications.

More from Anil Panchal
Share:

Editor's Picks

EUR/USD weakens below 1.1700 as Middle East tensions drive US Dollar strength

The EUR/USD pair trades with mild losses around 1.1685, the lowest since late January, during the early Asian session on Tuesday. The US Dollar gathers strength against the Euro as escalating tensions in the Middle East boost safe-haven currencies. The preliminary reading of the Harmonized Index of Consumer Prices from the Eurozone will be published later on Tuesday.  

GBP/USD hits new yearly lows near 1.3300

GBP/USD adds to the recent bearish tone, approaching to the key 1.3300 support to reach fresh YTD troughs against the backdrop of the robust performance of the US Dollar. Indeed, Cable’s decline comes amid the firm demand for the safe-haven space in the wake of the US and Israel attacks to Iran.

Gold defends bids as US-Iran war continues to fuel safe-haven flows

Gold retains positive bias for the fifth consecutive day on Tuesday as rising geopolitical tensions in the Middle East continue to underpin safe-haven assets. However, a bullish US Dollar keeps the bullion below its highest level since late January, set on Monday, warranting caution before positioning for any further appreciation.

Strategy lifts holdings to 3.4% of Bitcoin's total supply amid inflows into crypto products

Strategy continued its accumulation of the top crypto last week, acquiring 3,015 BTC for $204 million amid renewed interest in crypto products after four weeks of outflows.

The market is not panicking it is repricing the probability distribution of Oil and time

At the end of the day, markets do not trade morality or geopolitics. They trade transmission channels. And the only channel that truly matters in this maelstrom runs through the price of energy and the time value of money.

Grass 20% bullish breakout defies broader market weakness

Grass (GRASS) is edging up above $0.30 at the time of writing on Monday. The token’s notable 20% intraday surge stands out amid heightened volatility in the broader crypto market.