|

USD/MXN Price Analysis: Manages to hold above 100-day SMA, bias seems tilted in favour of bulls

  • USD/MXN struggles to gain any meaningful traction and oscillates in a range on Monday.
  • The technical setup supports prospects for some meaningful upside amid a bullish USD.
  • A break below last week's swing low will shift the bias back in favour of bearish traders.

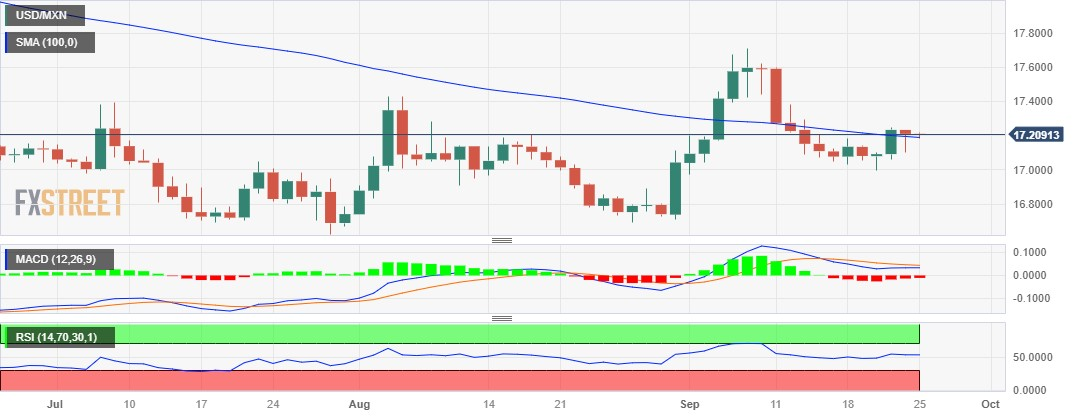
The USD/MXN pair manages to defend the 100-day Simple Moving Average (SMA) support through the Asian session on Monday, albeit struggles to gain any meaningful traction. Spot prices remain below the 17.2500 area, or last week's swing high, which should now act as a pivotal point for short-term traders.

With technical indicators on the daily chart holding in the positive territory, a sustained strength beyond should pave the way for some meaningful upside and lift the USD/MXN pair to the 17.3810 area (September 12 peak). Some follow-through buying has the potential to lift spot prices further towards the next relevant hurdle near the 17.5910-17.5960 horizontal zone en route to the monthly top, around the 17.7090-17.7095 region.

The US Dollar (USD) holds steady just below its highest level in more than six months and remains well supported by the Federal Reserve's (Fed) hawkish outlook, signalling the need to keep rates higher for longer to push inflation to the 2% target. This, along with the reduction in the expected number of rate cuts in 2024, continues to push the US bond yields higher and continues to underpin the USD, favouring the USD/MXN bulls.

Hence, any meaningful slide below the 100-day SMA might continue to attract fresh buyers near the 17.1010-17.0650 horizontal support. This, in turn, should help limit the downside for the USD/MXN pair near last week's swing low, around the 16.9980 area. which if broken decisively might shift the bias in favour of bearish traders. Spot prices might then turn vulnerable to retesting the 16.6945 area, or a multi-year low touched in August.

USD/MXN daily chart

fxsoriginal

Technical levels to watch

USD/MXN

Overview
Today last price17.2097
Today Daily Change-0.0013
Today Daily Change %-0.01
Today daily open17.211
 
Trends
Daily SMA2017.171
Daily SMA5017.0383
Daily SMA10017.1956
Daily SMA20017.892
 
Levels
Previous Daily High17.2374
Previous Daily Low17.1012
Previous Weekly High17.2506
Previous Weekly Low16.9982
Previous Monthly High17.4274
Previous Monthly Low16.6945
Daily Fibonacci 38.2%17.1532
Daily Fibonacci 61.8%17.1854
Daily Pivot Point S117.129
Daily Pivot Point S217.047
Daily Pivot Point S316.9927
Daily Pivot Point R117.2652
Daily Pivot Point R217.3194
Daily Pivot Point R317.4014

Author

Haresh Menghani

Haresh Menghani is a detail-oriented professional with 10+ years of extensive experience in analysing the global financial markets.

More from Haresh Menghani
Share:

Markets move fast. We move first.

Orange Juice Newsletter brings you expert driven insights - not headlines. Every day on your inbox.

By subscribing you agree to our Terms and conditions.

Editor's Picks

EUR/USD retreats toward 1.1700 on modest USD recovery

EUR/USD stays under mild bearish pressure and trades below 1.1750 on Friday. Although trading conditions remain thin following the New Year holiday and ahead of the weekend, the modest recovery seen in the US Dollar causes the pair to edge lower. The economic calendar will not feature any high-impact data releases.

GBP/USD struggles to gain traction, stabilizes near 1.3450

After testing 1.3400 on the last day of 2025, GBP/USD managed to stage a rebound. Nevertheless, the pair finds it difficult to gather momentum and trades marginally lower on the day at around 1.3450 as market participants remain in holiday mood.

Gold climbs toward $4,400 following deep correction

Gold advances toward $4,400 and gains more than 1.5% on the day after suffering heavy losses amid profit-taking heading into the end of the year. Growing expectations for a dovish Fed policy and persistent geopolitical risks seem to be helping XAU/USD stretch higher.

Cardano gains early New Year momentum, bulls target falling wedge breakout

Cardano kicks off the New Year on a positive note and is extending gains, trading above $0.36 at the time of writing on Friday. Improving on-chain and derivatives data point to growing bullish interest, while the technical outlook keeps an upside breakout in focus.

Economic outlook 2026-2027 in advanced countries: Solidity test

After a year marked by global economic resilience and ending on a note of optimism, 2026 looks promising and could be a year of solid economic performance. In our baseline scenario, we expect most of the supportive factors at work in 2025 to continue to play a role in 2026.

Crypto market outlook for 2026

Year 2025 was volatile, as crypto often is.  Among positive catalysts were favourable regulatory changes in the U.S., rise of Digital Asset Treasuries (DAT), adoption of AI and tokenization of Real-World-Assets (RWA).