|

USD/MXN Price Analysis: Flirts with 61.8% Fibo., just above 17.00 mark/50-day SMA

  • USD/MXN remains depressed near a one-and-half-week low touched on Thursday.
  • Some follow-through selling below the 50-day SMA will confirm a fresh breakdown.
  • Attempted recovery might now confront resistance near the 17.20-17.25 confluence.

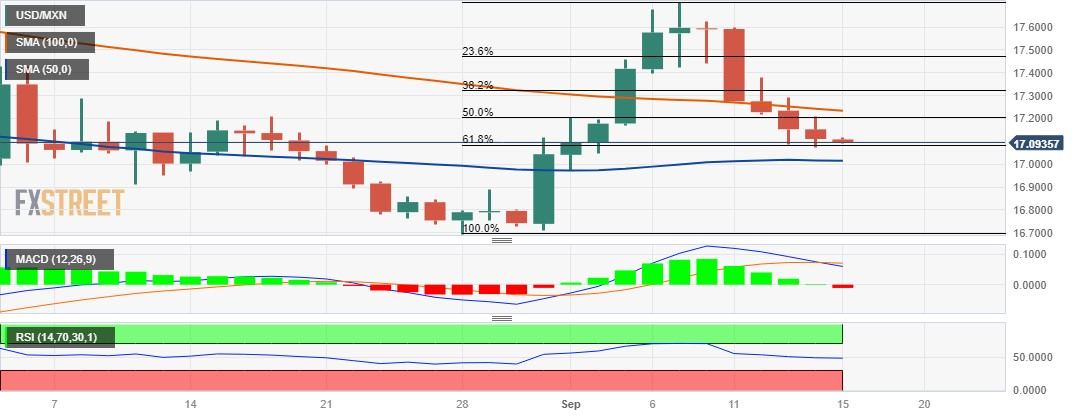
The USD/MXN pair struggles to gain any meaningful traction during the Asian session on Friday and languishes near the 17.10-17.05 region, or a one-and-half-week low touched the previous day.

The aforementioned area represents the 61.8% Fibonacci retracement level of the rally from the August monthly swing low, which should now act as a key pivotal point for intraday traders. Meanwhile, technical indicators on the daily chart have just started drifting in the negative territory and support prospects for an extension of the USD/MXN pair's downfall witnessed over the past week or so.

That said, it will still be prudent to wait for a convincing break below the 50-day Simple Moving Average (SMA), around the 17.00 mark, before positioning for a further depreciating move. Spot prices might then weaken below the 16.90 intermediate support and challenge a multi-year low, near the 16.70 area touched in August. Some follow-through selling will be seen as a fresh trigger for bearish traders.

On the flip side, any meaningful recovery might now confront stiff resistance and remain capped near the 17.20-17.25 confluence, comprising the 50% Fibo. level and the 100-day SMA. The next relevant hurdle is pegged near the 38.2% Fibo. level, around the 17.35 region, above which the USD/MXN could surpass the 23.6% Fibo. barrier near the 17.45-17.50 barrier and retest the multi-month top, around the 17.70 zone.

USD/MXN daily chart

fxsoriginal

Technical levels to watch

USD/MXN

Overview
Today last price17.0982
Today Daily Change-0.0120
Today Daily Change %-0.07
Today daily open17.1102
 
Trends
Daily SMA2017.0975
Daily SMA5017.0163
Daily SMA10017.2425
Daily SMA20017.9696
 
Levels
Previous Daily High17.209
Previous Daily Low17.0734
Previous Weekly High17.7094
Previous Weekly Low17.0447
Previous Monthly High17.4274
Previous Monthly Low16.6945
Daily Fibonacci 38.2%17.1252
Daily Fibonacci 61.8%17.1572
Daily Pivot Point S117.0527
Daily Pivot Point S216.9952
Daily Pivot Point S316.9171
Daily Pivot Point R117.1883
Daily Pivot Point R217.2664
Daily Pivot Point R317.3239

Author

Haresh Menghani

Haresh Menghani is a detail-oriented professional with 10+ years of extensive experience in analysing the global financial markets.

More from Haresh Menghani
Share:

Markets move fast. We move first.

Orange Juice Newsletter brings you expert driven insights - not headlines. Every day on your inbox.

By subscribing you agree to our Terms and conditions.

Editor's Picks

EUR/USD bounces toward 1.1750 as US Dollar loses strength

EUR/USD returned to the 1.1750 price zone in the American session on Friday, despite falling Wall Street, which indicates risk aversion. Trading conditions remain thin following the New Year holiday and ahead of the weekend, with the focus shifting to US employment and European data scheduled for next week.

GBP/USD nears 1.3500, holds within familiar levels

After testing 1.3400 on the last day of 2025, GBP/USD managed to stage a rebound. Nevertheless, the pair finds it difficult to gather momentum and trades with modest intraday gains at around 1.3490 as market participants remain in holiday mood.

Gold trims intraday gains, approaches $4,300

Gold retreated sharply from the $4,400  area and trades flat for the day in the $4,320 price zone. Choppy trading conditions exacerbated the intraday decline, although XAU/USD bearish case is out of the picture, considering growing expectations for a dovish Fed and persistent geopolitical tensions.

Cardano gains early New Year momentum, bulls target falling wedge breakout

Cardano kicks off the New Year on a positive note and is extending gains, trading above $0.36 at the time of writing on Friday. Improving on-chain and derivatives data point to growing bullish interest, while the technical outlook keeps an upside breakout in focus.

Economic outlook 2026-2027 in advanced countries: Solidity test

After a year marked by global economic resilience and ending on a note of optimism, 2026 looks promising and could be a year of solid economic performance. In our baseline scenario, we expect most of the supportive factors at work in 2025 to continue to play a role in 2026.

Crypto market outlook for 2026

Year 2025 was volatile, as crypto often is.  Among positive catalysts were favourable regulatory changes in the U.S., rise of Digital Asset Treasuries (DAT), adoption of AI and tokenization of Real-World-Assets (RWA).