|

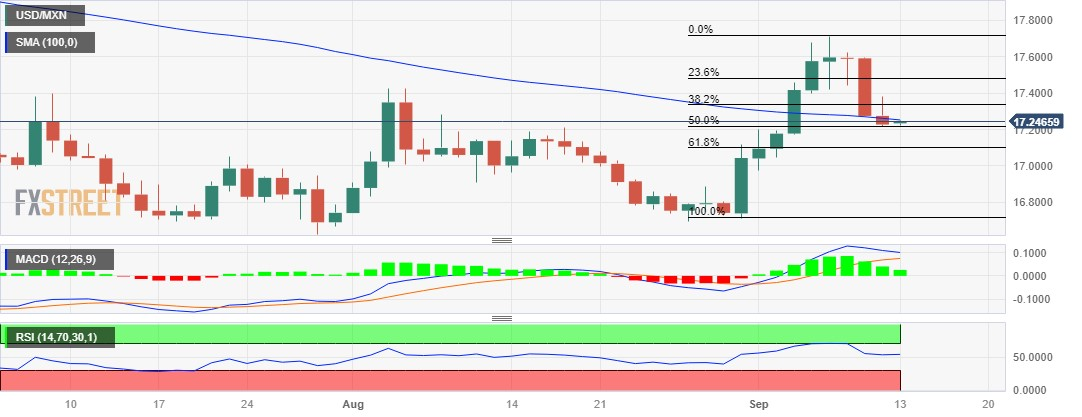
USD/MXN Price Analysis: Finds support near 50% Fibo., remains below 100-day SMA

  • USD/MXN consolidates its recent losses to a one-and-half-week trough touched on Tuesday.
  • The overnight breakdown and acceptance below the 100-day SMA favours bearish traders.
  • Positive oscillators on the daily chart warrant caution before positioning for further losses.

The USD/MXN pair struggles to gain any meaningful traction during the Asian session on Wednesday and consolidates its recent losses to a one-week low touched the previous day. Spot prices currently trade just above the 17.20 area, which represents the 50% Fibonacci retracement level of the rally from the August monthly swing low and should act as a pivotal point for intraday traders.

The overnight sustained breakdown through the 100-day Simple Moving Average (SMA) was seen as a fresh trigger for bears. That said, technical indicators on the daily chart –though have been easing from higher levels – are still holding in the positive territory. This, in turn, supports prospects for the emergence of some dip-buying at lower levels and warrants caution before positioning for any further depreciating move.

Some follow-through selling below the 17.20 level (50% Fibo.), however, has the potential to drag the USD/MXN pair to the 17.10 level, or the 61.8% Fibo. level. This is followed by the 17.00 round-figure mark, which if broken decisively will make spot prices vulnerable to weaken further towards the 16.90 area en route to the 16.70 region (August 28 low).

On the flip side, the 38.2% Fibo. level, around the 17.35 region, is likely to cap the immediate upside, above which the USD/MXN pair could climb to the 17.45-17.50 hurdle, or the 23.6% Fibo. level. This is followed by the multi-month top, around the 17.70 zone, which if cleared decisively will set the stage for the resumption of the recent strong appreciating move witnessed over the past two weeks or so.

USD/MXN daily chart

fxsoriginal

Technical levels to watch

USD/MXN

Overview
Today last price17.2422
Today Daily Change0.0148
Today Daily Change %0.09
Today daily open17.2274
 
Trends
Daily SMA2017.0964
Daily SMA5017.0159
Daily SMA10017.2617
Daily SMA20017.9948
 
Levels
Previous Daily High17.3811
Previous Daily Low17.2167
Previous Weekly High17.7094
Previous Weekly Low17.0447
Previous Monthly High17.4274
Previous Monthly Low16.6945
Daily Fibonacci 38.2%17.2795
Daily Fibonacci 61.8%17.3183
Daily Pivot Point S117.1691
Daily Pivot Point S217.1107
Daily Pivot Point S317.0047
Daily Pivot Point R117.3335
Daily Pivot Point R217.4395
Daily Pivot Point R317.4979

Author

Haresh Menghani

Haresh Menghani is a detail-oriented professional with 10+ years of extensive experience in analysing the global financial markets.

More from Haresh Menghani
Share:

Editor's Picks

EUR/USD recovers some early losses driven by rising energy prices amid US-Iran war

The EUR/USD pair claws back some of its early losses during the late Asian trading session on Monday, but is still 0.25% down to near 1.1780. Earlier in the day, the Euro declined sharply against the US Dollar as investors shifted to the safe-haven fleet amid the brutal war between Iran, Israel, and the United States, which broke out over the weekend.

GBP/USD targets 1.3500 barrier near moving averages

GBP/USD rebounds from the daily losses, trading around 1.3450 during the Asian hours on Monday. The technical analysis of the daily chart indicates an ongoing bearish bias, as the pair trades within a descending channel pattern.

Gold looks further north as Iran war boosts haven demand

Gold is taking a breather after the initial run to over one-month highs near $5,400, kicking off the new week with a bang. A global flight to safety theme, following the US-Israel joint attacks on Iran over the weekend, bolstered the demand for the traditional store of value, Gold.

Bitcoin, Ethereum and Ripple under pressure as key supports face breakdown risk

Bitcoin, Ethereum, and Ripple prices trade on the back foot at the start of this week on Monday, after extending losses in the previous week. BTC is on the brink of a breakdown, ETH is capped below key resistance, and XRP risks a crack of the trendline.

The market is paying for insurance, not apocalypse

As expected, this morning felt less like a Monday market open and more like a fire drill. Futures screens flickered red. S&P contracts down almost 1%. Nasdaq off 1.2%. Brent leaped 13% through $80. Gold rose 1.6% toward $5350 before paring some gains. The dollar is strutting mildly. The Swiss franc is quietly doing what it always does in a storm, catching some safe-haven flows.

Starknet unveils strkBTC, shielded Bitcoin transactions on Ethereum Layer 2

Starknet, the Ethereum Layer 2 network developed by StarkWare, today announced strkBTC, a wrapped Bitcoin asset that introduces optional shielding while preserving full DeFi composability.