|

USD/MXN Price Analysis: Divergence between price action and RSI warrants further upside

  • USD/MXN jumps from YTD lows around $18.33 and climbs to 18.40.
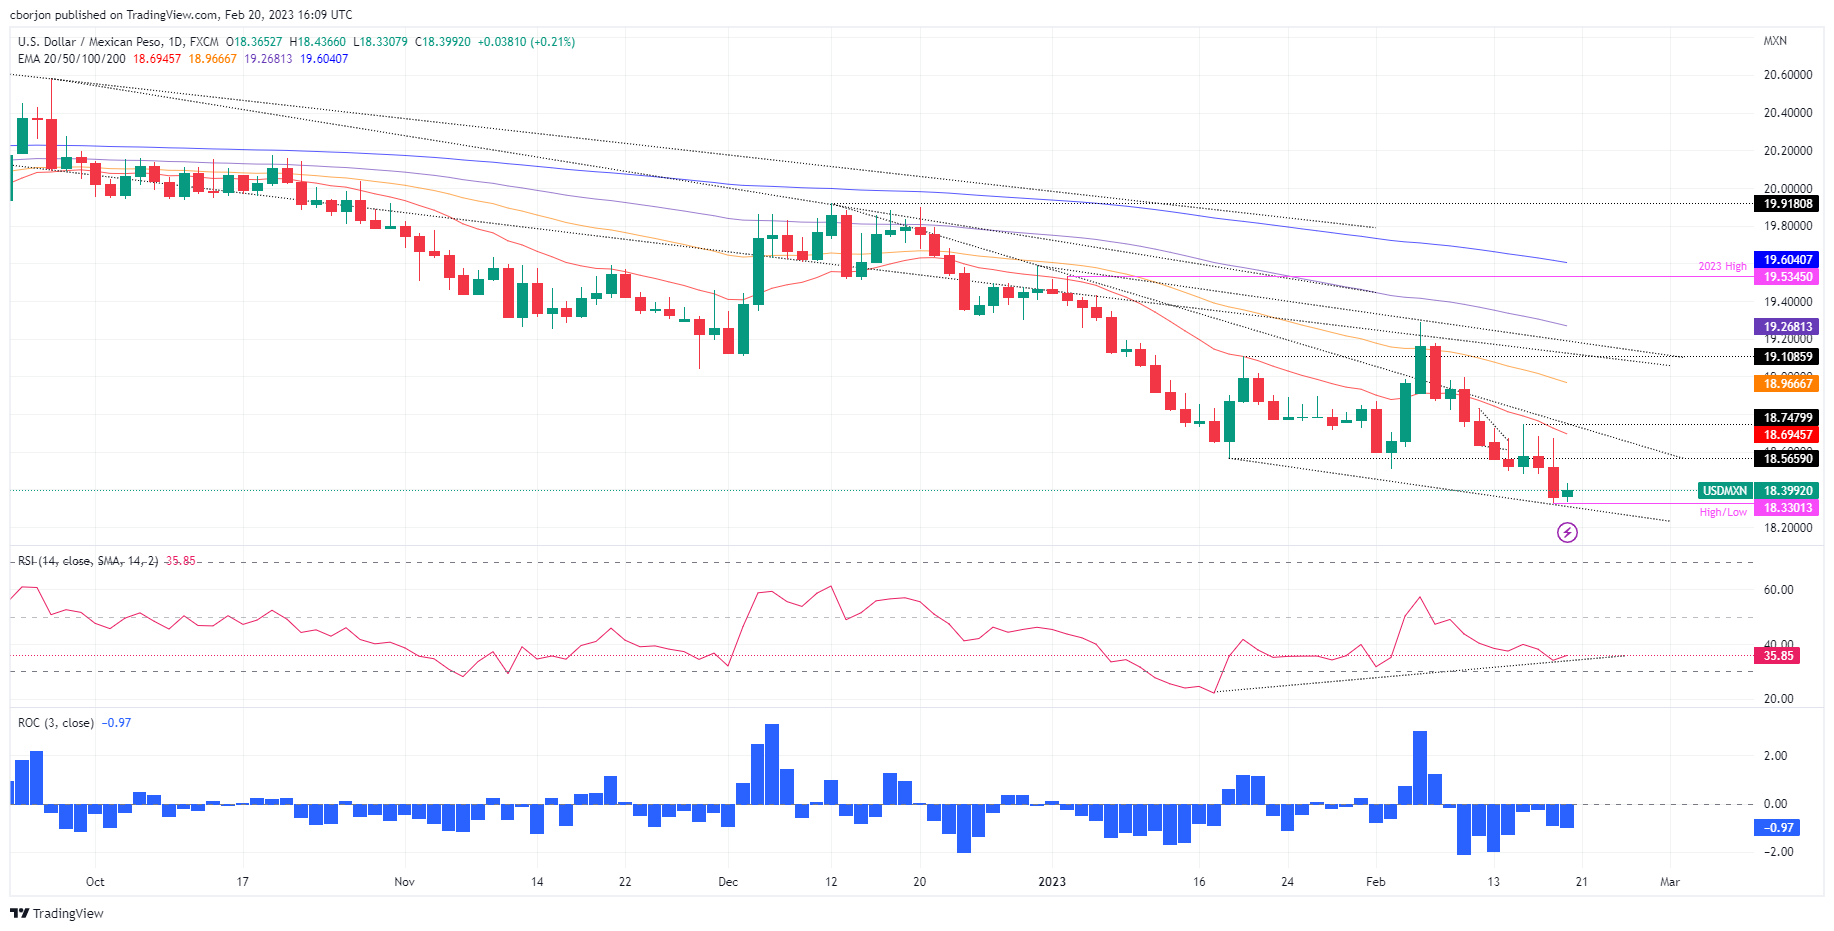
  • USD/MXN Price Analysis: Positive divergence remains, which could pave the way for a recovery.

The USD/MXN bounces after hitting multi-year lows around 18.3301, snapping three days of consecutive losses. Nevertheless, the USD/MXN would remain pressured after a strong downtrend dragged prices from the last year's $21.05 peak toward the above-mentioned $18.33 area. At the time of writing, the USD/MXN exchanges hand at 18.4076, above its opening price by 0.25%.

Technically speaking, the USD/MXN daily chart portrays a bearish continuation as the most likely scenario. However, the divergence between the USD/MXN price action and the Relative Strength Index (RSI) remains intact, which would spur a reversal that might open the door for the USD/MXN buyers to reclaim the $19.00 psychological level. This means as price action registered lower lows, the RSI has not. Therefore, risks for a reversal remain, which would open the door for further USD/MXN upside.

For that scenario to play out, the USD/MXN needs to crack the confluence of a downslope-resistance trendline and the 20-day Exponential Moving Average (EMA) at 18.6951, followed by the February 15 daily high at 18.7479, followed by the 50-day EMA At 18.9669, ahead of the 19.0000 psychological price level.

The USD/MXN must conquer the 18.4000 mark for a bearish continuation. Once cleared, that will expose the YTD low at 18.3301, followed by the psychological $18.00.

USD/MXN Daily chart

USD/MXN Key technical levels

USD/MXN

Overview
Today last price18.4014
Today Daily Change0.0438
Today Daily Change %0.24
Today daily open18.3576
 
Trends
Daily SMA2018.74
Daily SMA5019.0894
Daily SMA10019.3895
Daily SMA20019.7607
 
Levels
Previous Daily High18.6756
Previous Daily Low18.3306
Previous Weekly High18.754
Previous Weekly Low18.3306
Previous Monthly High19.5361
Previous Monthly Low18.5663
Daily Fibonacci 38.2%18.4623
Daily Fibonacci 61.8%18.5438
Daily Pivot Point S118.2336
Daily Pivot Point S218.1096
Daily Pivot Point S317.8886
Daily Pivot Point R118.5785
Daily Pivot Point R218.7995
Daily Pivot Point R318.9235

Author

Christian Borjon Valencia

Christian Borjon began his career as a retail trader in 2010, mainly focused on technical analysis and strategies around it. He started as a swing trader, as he used to work in another industry unrelated to the financial markets.

More from Christian Borjon Valencia
Share:

Markets move fast. We move first.

Orange Juice Newsletter brings you expert driven insights - not headlines. Every day on your inbox.

By subscribing you agree to our Terms and conditions.

Editor's Picks

EUR/USD steadies near 1.1750 ahead of final Eurozone CPI amid fading USD recovery

The EUR/USD pair steadies around the 1.1750 area during the Asian session on Wednesday, and for now, seems to have stalled the previous day's sharp retracement slide from the highest level since September 24. Meanwhile, the fundamental backdrop remains tilted in favor of bullish traders and suggests that the path of least resistance for spot prices remains to the upside.

GBP/USD gains ground above 1.3400 on UK PMI optimism

The GBP/USD pair gains momentum to around 1.3425 during the early Asian session on Wednesday. The Pound Sterling edges higher against the Greenback on the upbeat UK preliminary S&P Global Purchasing Managers' Index data. Traders will take more cues from the Fedspeak later on Wednesday. 

Gold advances to near seven-week highs amid US labor market cooling

Gold price extends its upside to near seven-week highs above $4,300 during the Asian trading hours on Wednesday. The precious metal gains momentum as the US labor market remains relatively resilient but shows signs of slowing. The mixed US employment report for November reinforces bets of further rate cuts by the US Federal Reserve and weighs on the US Dollar.

XRP dips as bearish pressure persists despite ETF growth

Ripple is finding footing above $1.90 at the time of writing on Tuesday after a bearish wave swept across the broader cryptocurrency market, building on persistent negative sentiment.

Ukraine-Russia in the spotlight once again

Since the start of the week, gold’s price has moved lower, but has yet to erase the gains made last week. In today’s report we intend to focus on the newest round of peace talks between Russia and Ukraine, whilst noting the release of the US Employment data later on day and end our report with an update in regards to the tensions brewing in Venezuela.

BNB Price Forecast: BNB slips below $855 as bearish on-chain signals and momentum indicators turn negative

BNB, formerly known as Binance Coin, continues to trade down around $855 at the time of writing on Tuesday, after a slight decline the previous day. Bearish sentiment further strengthens as BNB’s on-chain and derivatives data show rising retail activity.