|

USD/MXN Price Analysis: Collapses to 4 ½-year lows around 18.4000

  • USD/MXN drops below last Thursday’s low, extending its losses to a fresh multi-year low of around $18.40.
  • USD/MXN Price Analysis: A break below $18.40 would pave the way toward $18.00.

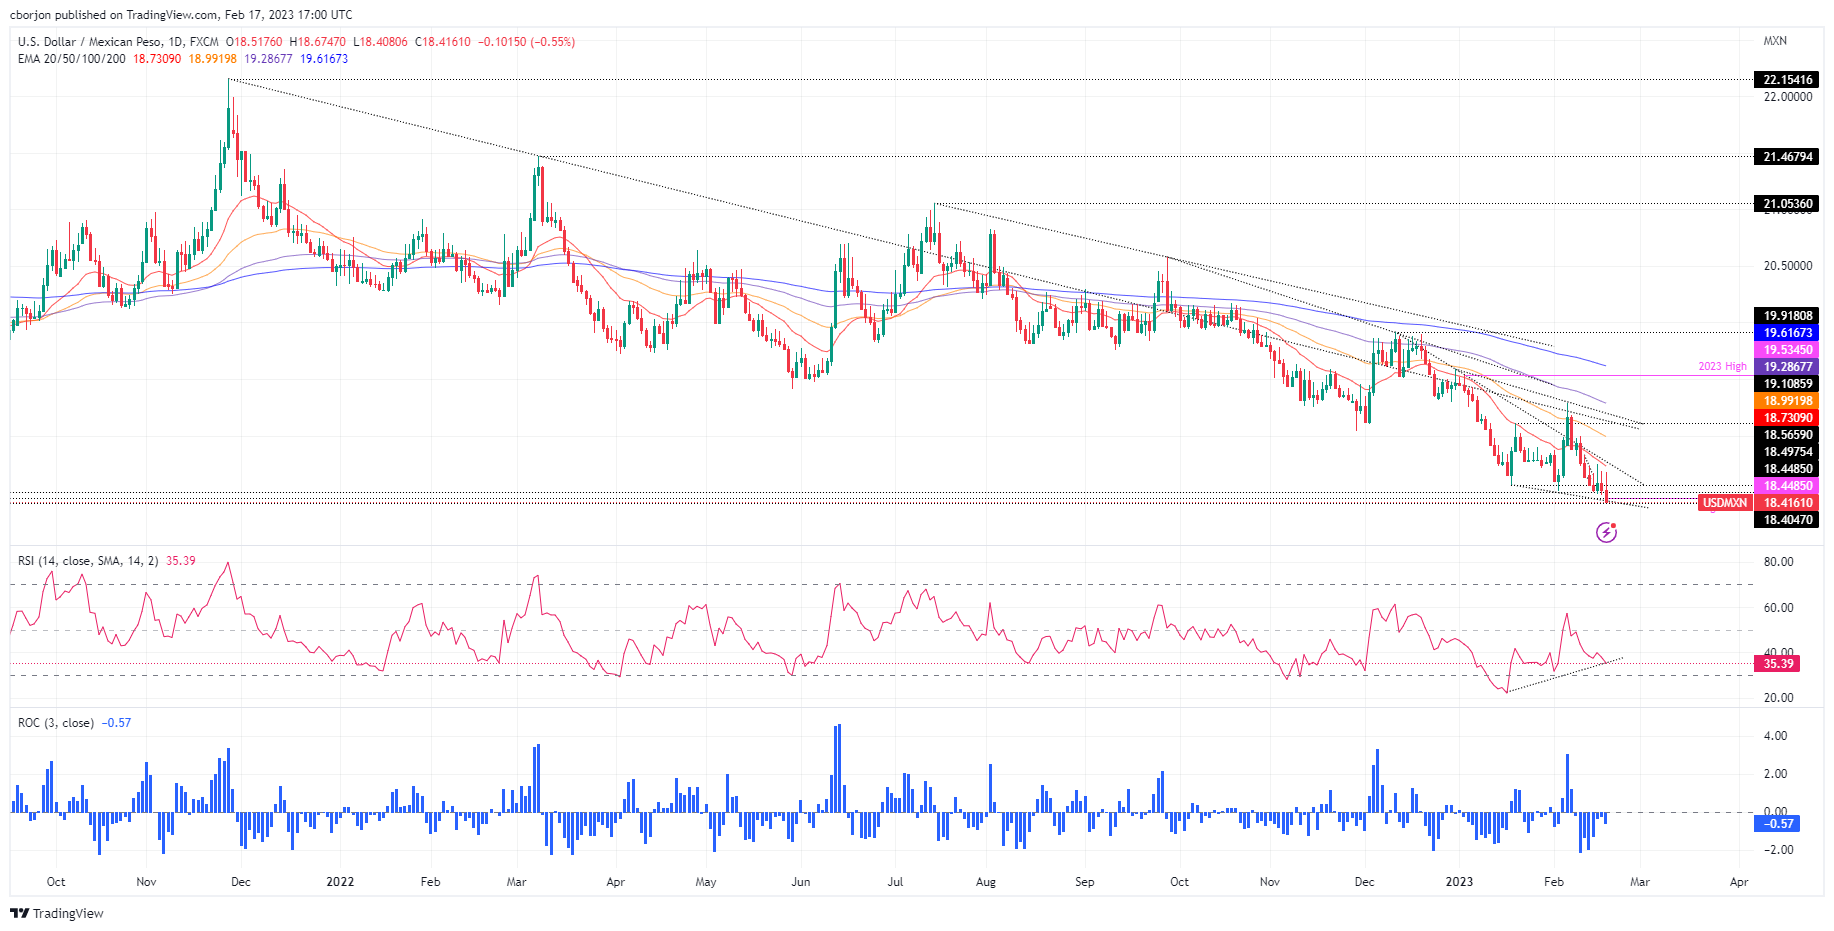
The USD/MXN hit an almost 4-year-and-a-half month low around 18.4485, a level last seen in October 2018, extending its losses by 0.89% in the week. At the time of writing, the USD/MXN exchanges hands at 18.4161.

Since the beginning of the week, the Mexican Peso (MXN) has shown resilience to register a daily loss vs. the greenback (USD). Even though the USD/MXN Tuesday’s session finished in the green, prices were reluctant to break solid resistance around the 20-day Exponential Moving Average (EMA) at 18.7999 that day. Albeit the USD/MXN closed with gains of 0.31%, analyzing price action, the large wick on top of Tuesday’s candle’s body was a forecast of what was upcoming in the rest of the week.

Hence, the USD/MXN dropped for two consecutive days, and it’s on its way toward the 18.00 psychological level, as it has decisively broken the $18.50 mark.

The USD/MXN’s next support would be August 7, 2018, daily low at 18.4047. Breach of the latter and the next support would be the psychological $18.00 barrier. Once cleared, the USD/MXN would dip to April 17, 2018, swing low at 17.9388, which would be up for grabs.

Contrarily, if the USD/MXN reconquers $18.50, that could open the door for recovery. Therefore, the USD/MXN first resistance would be the 20-day EMA At 18.7312, followed by the confluence of the February 9 daily high and the 50-day EMA around 18.9922. Once cleared, the next stop will be the 100-day EMA at 19.2869.

USD/MXN Daily chart

USD/MXN Key technical levels

USD/MXN

Overview
Today last price18.4278
Today Daily Change-0.1038
Today Daily Change %-0.56
Today daily open18.5316
 
Trends
Daily SMA2018.7661
Daily SMA5019.1176
Daily SMA10019.4073
Daily SMA20019.7694
 
Levels
Previous Daily High18.6845
Previous Daily Low18.4807
Previous Weekly High19.2901
Previous Weekly Low18.639
Previous Monthly High19.5361
Previous Monthly Low18.5663
Daily Fibonacci 38.2%18.5586
Daily Fibonacci 61.8%18.6066
Daily Pivot Point S118.4467
Daily Pivot Point S218.3619
Daily Pivot Point S318.243
Daily Pivot Point R118.6504
Daily Pivot Point R218.7693
Daily Pivot Point R318.8542

Author

Christian Borjon Valencia

Christian Borjon began his career as a retail trader in 2010, mainly focused on technical analysis and strategies around it. He started as a swing trader, as he used to work in another industry unrelated to the financial markets.

More from Christian Borjon Valencia
Share:

Markets move fast. We move first.

Orange Juice Newsletter brings you expert driven insights - not headlines. Every day on your inbox.

By subscribing you agree to our Terms and conditions.

Editor's Picks

EUR/USD tests nine-day EMA support near 1.1750

EUR/USD loses ground for the fourth consecutive session, trading around 1.1760 during the Asian hours on Monday. On the daily chart, technical analysis indicates a weakening bullish bias, as the pair tests to break below the lower boundary of the ascending channel pattern.

GBP/USD softens below 1.3500 but retains positive technical outlook

The GBP/USD pair loses momentum near 1.3485 during the early European session on Monday, pressured by renewed US Dollar demand. The potential downside for a major pair might be limited, as the Bank of England guided that monetary policy will remain on a gradual downward path.

Gold pulls back from record high as profit-taking sets in

Gold price retreats from a record high near $4,550 during the early European trading hours on Monday as traders book some profits ahead of holidays. A renewed US Dollar could also weigh on the precious metal, as it makes Gold more expensive for non-US buyers, pressuring prices.

Bitcoin, Ethereum, and XRP bulls regain strength

Bitcoin, Ethereum, and Ripple record roughly 3% gains on Monday, regaining strength mid-holiday season. Despite thin liquidity in the holiday season, BTC and major altcoins are regaining strength as US President Donald Trump pushes peace talks between Russia and Ukraine. The technical outlook for Bitcoin, Ethereum, and Ripple gradually shifts bullish as selling pressure wanes.

Economic outlook 2026-2027 in advanced countries: Solidity test

After a year marked by global economic resilience and ending on a note of optimism, 2026 looks promising and could be a year of solid economic performance. In our baseline scenario, we expect most of the supportive factors at work in 2025 to continue to play a role in 2026.

Avalanche struggles near $12 as Grayscale files updated form for ETF

Avalanche trades close to $12 by press time on Wednesday, extending the nearly 2% drop from the previous day. Grayscale filed an updated form to convert its Avalanche-focused Trust into an ETF with the US Securities and Exchange Commission.