|

USD/MXN Price Analysis: Bears run out of steam within a 10-pip zone around 18.00

  • USD/MXN retreats from intraday high, snaps two-day losing streak.
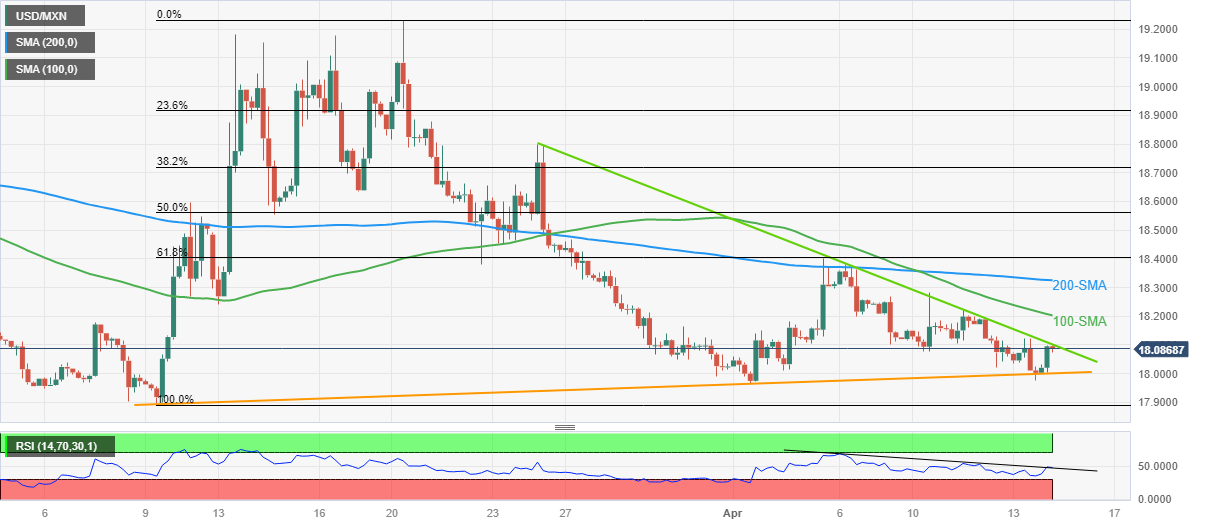
  • Three-week-old descending trend line restricts immediate upside ahead of the key SMAs.
  • RSI pokes short-term resistance line during eight-day-long bearish trend, suggesting return of upside momentum.
  • Rising support line from early March, YTD low joins downbeat RSI to challenge Mexican Peso buyers.

USD/MXN eases from the intraday high to 18.08 during the first positive day in three heading into Friday’s European session.

In doing so, the Mexican Peso (MXN) pair retreats from a downward-sloping resistance line from late March while fading the bounce off a five-week-old support line, marked the previous day.

Given the downward-sloping RSI (14), the USD/MXN weakness appears elusive. On top of that, the RSI line currently pokes an eight-day-long trend line resistance and hence a breakout can allow the momentum to improve, which in turn can trigger the pair’s rebound.

However, the 100-SMA and the 200-SMA levels, respectively around 18.20 and 18.32, can challenge the USD/MXN bulls. Also acting as an upside filter is the monthly high of 18.40.

It’s worth noting that the Mexican Peso buyers need validation from an upward-sloping support line from early March, around the 18.00 round figure, as well as from the RSI (14) that is currently weak.

Even if the USD/MXN price breaks the 18.00 support, the Year-To-Date (YTD) support near 17.89, marked in March, should lure the bears.

USD/MXN: Four-hour chart
Trend: Recovery expected

Additional important levels

Overview
Today last price18.08
Today Daily Change0.0674
Today Daily Change %0.37%
Today daily open18.0126
 
Trends
Daily SMA2018.3034
Daily SMA5018.4205
Daily SMA10018.8379
Daily SMA20019.4358
 
Levels
Previous Daily High18.1237
Previous Daily Low17.9753
Previous Weekly High18.4018
Previous Weekly Low17.966
Previous Monthly High19.2324
Previous Monthly Low17.8977
Daily Fibonacci 38.2%18.032
Daily Fibonacci 61.8%18.067
Daily Pivot Point S117.9507
Daily Pivot Point S217.8888
Daily Pivot Point S317.8022
Daily Pivot Point R118.0991
Daily Pivot Point R218.1856
Daily Pivot Point R318.2475

Author

Anil Panchal

Anil Panchal

FXStreet

Anil Panchal has nearly 15 years of experience in tracking financial markets. With a keen interest in macroeconomics, Anil aptly tracks global news/updates and stays well-informed about the global financial moves and their implications.


More from Anil Panchal
Share:

Editor's Picks

GBP/USD: Daily gains remain capped by 1.3650

GBP/USD leaves behind Monday’s pessimism and advances marginally on Tuesday. Cable’s humble gains, however, appear to have met quite a decent resistance in the 1.3650 zone for now, in a context of a slight selling pressure hovering around the Greenback.

EUR/USD struggles to regain pace; gyrates around 1.1670

EUR/USD clinches humble gains around 1.1670 following Tuesday’s close on Wall Street. Indeed, marginal losses in the US Dollar encourages spot to set aside two dauly pullbacks in a row and maintain the 1.1700 barrier on the cross-hairs for now. Moving forward, US inflation tracked by the PCE and another revision of Q2 GDP data should keep investors entertained on Wednesday.

Gold steadies near $4,650, eyes multi-month high ahead of US PCE

Gold stabilizes around $4,650 after the previous day's two-way swings as traders await the US PCE data, due later this Wednesday, for cues about the Fed's policy path. The outlook will drive the US Dollar and the non-yielding bullion. Meanwhile, renewed hopes for a US-Iran peace deal, weak oil prices, sliding US bond yields and diminishing odds of an immediate tightening by the Fed undermine the USD. This keeps the precious metal close to its highest level since May 14, set on Tuesday.

Australia CPI expected to show inflation easing in July
The Australian Bureau of Statistics (ABS) will publish the July Consumer Price Index (CPI) on Wednesday at 01:30 GMT. The report is expected to show that inflation rose 3.2% from a year earlier, easing from the 3.8% posted in June. The monthly CPI, however, is forecast at 0.8% following the -0.1% print from the previous month.
Canada hits US goods with tariffs; The rate market sees a problem
On September 8, Canada begins charging its own importers 15%, 25% and 50% on roughly 700 lines of American goods. The measure is billed as dollar for dollar, and on the arithmetic of covered trade it is. What it is not is a tax on the United States.
Canada hits US goods with tariffs; The rate market sees a problem
On September 8, Canada begins charging its own importers 15%, 25% and 50% on roughly 700 lines of American goods. The measure is billed as dollar for dollar, and on the arithmetic of covered trade it is. What it is not is a tax on the United States.