|

USD/MXN Price Analysis: Back above 20.00, losing momentum

  • USD/MXN rises for the third consecutive day, again above 20.00.
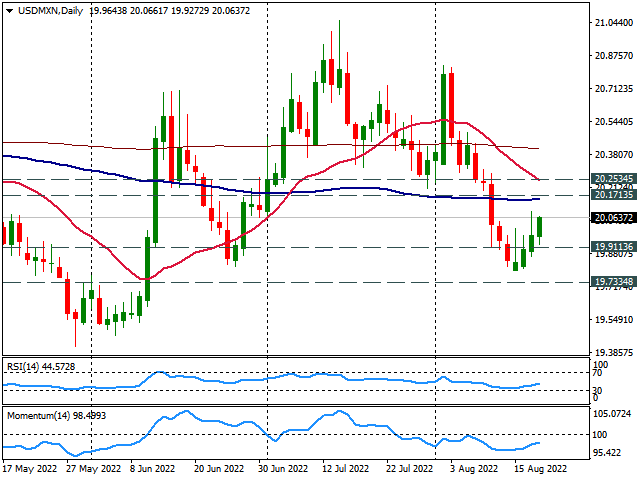
  • The dollar needs to hold above 20.00, next resistance at 20.15/20.
  • Slide under 19.90 to remove bullish bias.

The USD/MXN is rising for the third consecutive day, although so far, it has failed to print fresh weekly highs. The upside remains capped below 20.10. The next critical resistance is seen around 20.15/20, an area that contains horizontal resistances and also the 100-day Simple Moving Average.

A firm break above 20.25 would open the doors to more gains targeting the 20.50 area.

In the very short term, the bias is to the upside, with technical indicators flat to bullish. The momentum is not strong enough and appears to be fading. The bias will weaken with a decline back under 20.00. While a daily close well above 20.00 would be a positive sign for the bulls.

A key support emerges at 19.90 that if fails to hold, USD/MXN could drop further to test again the 19.80 area.

USD/MXN Daily chart

USD/MXN

Overview
Today last price20.0397
Today Daily Change0.0629
Today Daily Change %0.31
Today daily open19.9768
 
Trends
Daily SMA2020.2785
Daily SMA5020.3164
Daily SMA10020.154
Daily SMA20020.4165
 
Levels
Previous Daily High20.0921
Previous Daily Low19.8189
Previous Weekly High20.4435
Previous Weekly Low19.8104
Previous Monthly High21.0539
Previous Monthly Low20.0921
Daily Fibonacci 38.2%19.9878
Daily Fibonacci 61.8%19.9233
Daily Pivot Point S119.8331
Daily Pivot Point S219.6894
Daily Pivot Point S319.5599
Daily Pivot Point R120.1063
Daily Pivot Point R220.2358
Daily Pivot Point R320.3795

Author

Matías Salord

Matías started in financial markets in 2008, after graduating in Economics. He was trained in chart analysis and then became an educator. He also studied Journalism. He started writing analyses for specialized websites before joining FXStreet.

More from Matías Salord
Share:

Editor's Picks

EUR/USD looks sidelined around 1.1850

EUR/USD remains on the back foot, extending its bearish tone and sliding towards the 1.1850 area to print fresh daily lows on Monday. The move lower comes as the US Dollar gathers modest traction, with thin liquidity and subdued volatility amplifying price swings amid the US market holiday.

GBP/USD flirts with daily lows near 1.3630

GBP/USD has quickly given back Friday’s solid gains, turning lower at the start of the week and drifting back towards the 1.3630 area. The focus now shifts squarely to Tuesday’s UK labour market report, which is likely to keep the quid firmly in the spotlight and could set the tone for Cable’s next move.

Gold battle around $5,000 continues

Gold is giving back part of Friday’s sharp rebound, deflating below the key $5,000 mark per troy ounce as the new week gets underway. Modest gains in the US Dollar are keeping the metal in check, while thin trading conditions, due to the Presidents Day holiday in the US, are adding to the choppy and hesitant tone across markets.

Bitcoin consolidates as on-chain data show mixed signals

Bitcoin price has consolidated between $65,700 and $72,000 over the past nine days, with no clear directional bias. US-listed spot ETFs recorded a $359.91 million weekly outflow, marking the fourth consecutive week of withdrawals.

The week ahead: Key inflation readings and why the AI trade could be overdone

It is likely to be a quiet start to the week, with US markets closed on Monday for Presidents Day. European markets are higher across the board and gold is clinging to the $5,000 level after the tamer than expected CPI report in the US reduced haven flows to precious metals.

XRP steadies in narrow range as fund inflows, futures interest rise

Ripple is trading in a narrow range between $1.45 (immediate support) and $1.50 (resistance) at the time of writing on Monday. The remittance token extended its recovery last week, peaking at $1.67 on Sunday from the weekly open at $1.43.