|

USD/MXN grinds lower as bears eye 20.15 despite a firm US dollar

  • The Mexican peso advances firm vs. the greenback, despite falling oil prices.
  • An upbeat market sentiment boosts emerging market currencies.
  • USD/MXN Price Forecast: Neutral biased, but up and downside risks remain.

The Mexican peso rallies firmly despite that the US Federal Reserve hiked rates for the first time in three years, but interest rates differentials still favor the Mexican peso. At 20.2964. the USD/MXN reflects the 5.50% differential between Mexico and the US.

In the meantime, European and US stock markets continue advancing during the day, reflecting the positive market sentiment. Meanwhile, oil prices dropped from daily highs near the $115.00 mark as Germany and Hungary backpedaled from a potential embargo on Russian oil, easing pressures on the black gold. That stopped the fall of the USD/MXN pair, as traders were looking to push the exchange rate towards February 23 daily low at 20.1558, short of the psychological 20.00 barrier.

Meanwhile, the US Dollar Index advances on the day some 0.96%, sitting at 98.536, putting a headwind for the USD/MXN.

Overnight, the USD/MXN opened near Monday’s low, around 20.30s. Once the North American session began following a bank’s holiday in Mexico, the Mexican peso strengthened as USD/MXN traders pushed the pair towards 20.2494 lows.

USD/MXN Price Forecast: Technical outlook

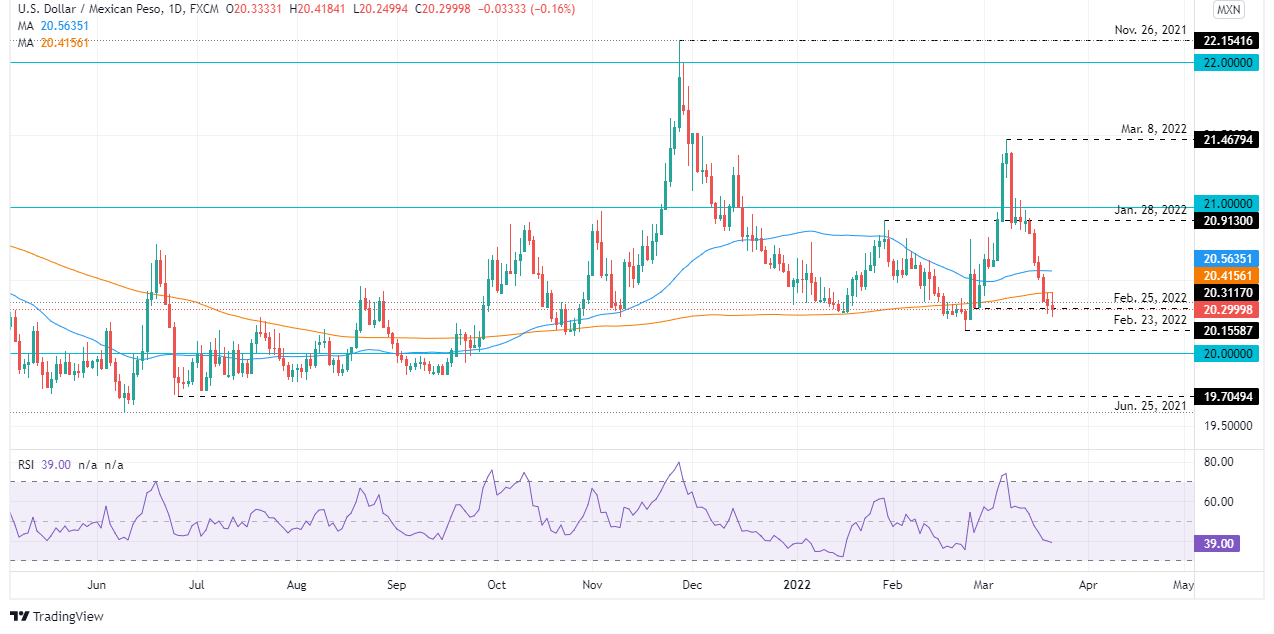
The USD/MXN bias is neutral, as depicted by the daily chart. On Friday last week, the USD/MXN broke below the 200-DMA at 20.4155, exacerbating a move towards the YTD lows. Nevertheless, USD/MXN traders need to be aware that a dampened market mood, would significantly affect Emerging Markets’ currencies, weakening the peso.

Upwards, the USD/MXN first resistance would be the 200-DMA at 20.4155. Breach of the latter would expose the 50-DMA at 20.5634, followed by the January 28 cycle high at 20.9130, short of the 21.00 barrier. On the flip side, the USD/MXN first support would be February 23 daily low at 20.1558, followed by the psychological 20.00 barrier and June 25, 2021 low at 19.7050.
USD/MXN

Overview
Today last price20.2964
Today Daily Change-0.0842
Today Daily Change %-0.41
Today daily open20.3756
 
Trends
Daily SMA2020.6962
Daily SMA5020.5778
Daily SMA10020.7078
Daily SMA20020.4256
 
Levels
Previous Daily High20.4153
Previous Daily Low20.2684
Previous Weekly High20.9836
Previous Weekly Low20.3572
Previous Monthly High20.7904
Previous Monthly Low20.1571
Daily Fibonacci 38.2%20.3245
Daily Fibonacci 61.8%20.3592
Daily Pivot Point S120.2909
Daily Pivot Point S220.2062
Daily Pivot Point S320.144
Daily Pivot Point R120.4378
Daily Pivot Point R220.5
Daily Pivot Point R320.5847

Author

Christian Borjon Valencia

Markets analyst, news editor, and trading instructor with over 14 years of experience across FX, commodities, US equity indices, and global macro markets.


More from Christian Borjon Valencia
Share:

Editor's Picks

GBP/USD clings to multi-day peaks below 1.3500

GBP/USD trades with marked gains on Friday, now giving away some gains following an earlier surpass of the key 1.3500 yardstick. Indeed, Cable gathers fresh steam amid the strong offered stance in the Greenback, all after US NFP badly missed expectations in July.

EUR/USD: Post-NFP bounce falters around 1.1580

EUR/USD reverses Thursday’s decline and trades with solid gains in the 1.1560 region, or two-month peaks, on Friday. The pair’s firm performance comes in a context of a sharp correction in the US Dollar as investors continue to assess disheartening US NFP readings.

How Wall Street rigs the game [Video]

In this week’s Live from the Vault, Andrew Maguire is joined by Peter Antico and Sean Stone to discuss the Paradigm of Money - an in-depth expose of financial market corruption, from naked shorting to the two-tier system that protects Wall Street.

XRP Price Forecast: XRP nears critical $1.00 support
Ripple (XRP) remains pressured on Friday, trading around $1.03 at the time of writing. The token appears to hold this current level as support but lacks a catalyst to sustain a knee-jerk rebound toward the next key resistance at $1.10.
Is Gold about to enter its biggest bull run since 2020?
Gold has stormed back into the spotlight and its next move could leave late buyers chasing. On August 5, the yellow metal surged almost 7% – roughly $174 – to close near $4,308 an ounce, posting one of its biggest daily advances in recent history. A weaker U.S dollar, falling Treasury yields, changing Federal Reserve expectations and renewed safe-haven demand all struck at once.
9-3: Is the Federal Reserve’s vote tally Warsh's new forward guidance?
The rate did not move. Neither did the statement, and that’s the more interesting fact. Set the July 29 Federal Open Market Committee (FOMC) statement beside the one issued on June 17, and the two documents are identical apart from a single verb and a paragraph at the bottom naming three dissenters.