USD/MXN drops sharply as the Mexican Peso eyes 17.0000
- USD/MXN trades at 17.0741, down 0.19%, as the pair slides below the 20-day Moving Average, targeting the psychological 17.0000 level.
- Mixed US data, including a drop in inflation expectations, leaves investors uncertain about further Fed tightening beyond September.
- Technical outlook suggests downside risks below the 50-DMA at 17.0079 while reclaiming the 100-DMA at 17.2271 could spur a recovery.

The Mexican Peso (MXN) extends its gains versus the US Dollar (USD), and prolongs its rally to five consecutive days, with USD/MXN bears setting their sight on the 17.0000 psychological level after sliding below the 20-day Moving Average (DMA) at 17.0921. The pair exchanges hands at 17.0741, down 0.19%.
USD/MXN slips further as mixed US data fails to lift the Greenback, while traders eye a packed economic calendar in Mexico next week
Data from the United States (US) so far failed to bolster the Greenback (USD) as inflation expectations dropped the most in two years, as revealed by the University of Michigan (UoM) Consumer Sentiment poll. Inflation is expected to climb at a 3.1% pace, down from August 3.5%, and estimate a 2.7% jump over a 10-year period. Despite America’s optimism on inflation, sentiment fell to 677 below estimates of 69.1, blamed on high food and energy prices.
Before Wall Street opened, Industrial Production in August rose by 0.4% MoM, below July’s 1% increase but above the 0.1% estimated by the consensus, as the US Federal Reserve revealed. That depicts consumers taking a breather as retailers posted limited orders on manufacturers, struggling with higher borrowing costs and uncertainty on demand.
At the same time, the New York Fed revealed its Manufacturing Index, which expanded this month from -21 to 1.9, exceeding forecasts of -10. Given the amount of data posting positive surprises about the US economy, investors remain hesitant that the US Federal Reserve would continue to tighten monetary policy past the September meeting.
Across the border, a scarce economic docket left USD/MXN traders adrift to market sentiment and US Dollar dynamics. Nevertheless, next week’s agenda will be busy, with the release of Private Spending, Aggregate Demand, Retail Sales, Economic Activity, and inflation for the first half of September.
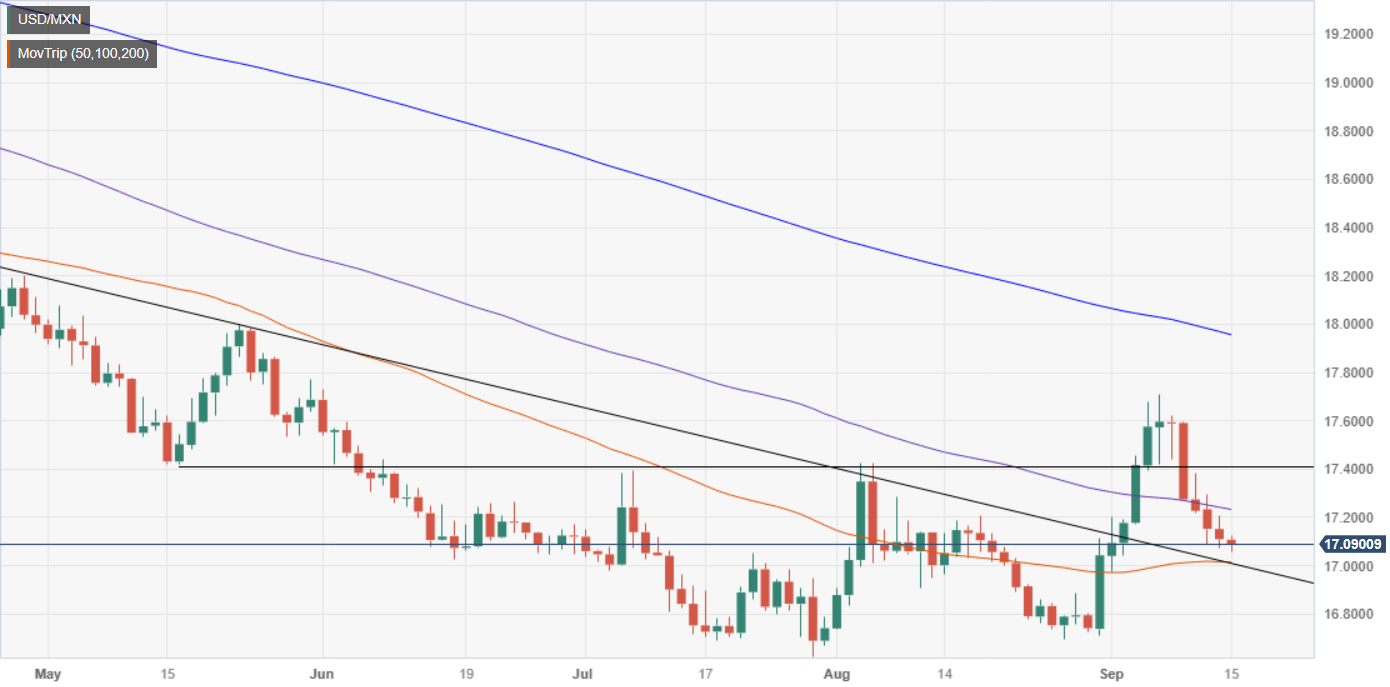
USD/MXN Price Analysis: Technical outlook
The USD/MXN remains neutrally biased despite printing a new multi-month high. After reaching 17.7074, the pair’s pullback could offer buyers a better entry price than last week’s close. However, downside risks remain and emerge slightly below the 50-DMA at 17.0079. Once cleared, a test of the August 28 swing low of 16.6923 is on the cards. On the other hand, if buyers reclaim the 100-DMA at 17.2271, that would exacerbate a recovery towards September’s high of 17.7074.
Author

Christian Borjon Valencia
FXStreet
Markets analyst, news editor, and trading instructor with over 14 years of experience across FX, commodities, US equity indices, and global macro markets.