USD/MXN dives to new seven-year low on US Dollar weakness, post-US inflation data
- USD/MXN falls over 0.30% as US headline inflation drops, encouraging Fed’s likely pause in June.
- Despite the US Dollar drop, Treasury bond yields rise; 10-year note at 3.827%.
- Bank of Mexico Governors emphasize the need for maintaining higher rates.

USD/MXN tumbles to fresh seven-year lows, achieved during the last six trading days, courtesy of US Dollar (USD) weakness. A US inflation report sent the US Dollar sliding against most G10 FX peers, alongside the Mexican Peso (MXN). At the time of writing, the USD/MXN is trading at 17.2164, down more than 0.30%.
Upbeat market sentiment and cooling US inflation boost risk-sensitive Mexican Peso
The market sentiment remains upbeat, a positive sign for the Mexican Peso, which is seen as a risk-sensitive currency. May inflation in the US flashed signs of cooling down, with headline inflation, known as the Consumer Price Index (CPI), dropping 0.8% from April’s 4.9% to 4% YoY. Additionally, excluding volatile items like food and energy, also known as Core CPI, edged lower, 0.2% to 5.3% YoY, aligned with estimates. However, core CPI month-over-month (MoM) remained unchanged for the second straight month, indicating that inflation still lingers in the economy.
Following the data release, the US Dollar Index (DXY), which measures the buck’s value against a basket of its rivals, dives 0.27% at 103.347 after hitting three-week lows. At the same time, US Treasury bond yields, particularly the 10-year benchmark note, are at 3.827%, eight basis points higher than its opening price.
That said, Wall Street expects the Fed to pause in June but is likely to resume in July, according to the latest figures reported by the CME FedWatch Tool. Money market futures odds for a quarter percentage increase to the Federal Funds Rate (FFR) are 62.5% and continue to aim up compared to the last week.
In tomorrow’s Federal Reserve Open Market Committee (FOMC)meeting, the Federal Reserve will also update the Summary of Economic Projections (SEP) and the Dot-Plot, which is foreseen to cement the Fed’s hawkish stance, not as a dovish pivot.
Across the border, the Mexican economic docket was absent. Still, the latest remarks by the Bank of Mexico (Banxico) Governors, Victoria Rodriguez Ceja and Jonathan Heath, stressed the need to hold higher rates for at least two meetings.
Upcoming events
On Wednesday, the US economic agenda will feature May’s Producer Price Index (PPI), the FOMC’s decision, and Fed’s Chair Jerome Powell’s press conference.
USD/MXN Price Analysis: Technical outlook
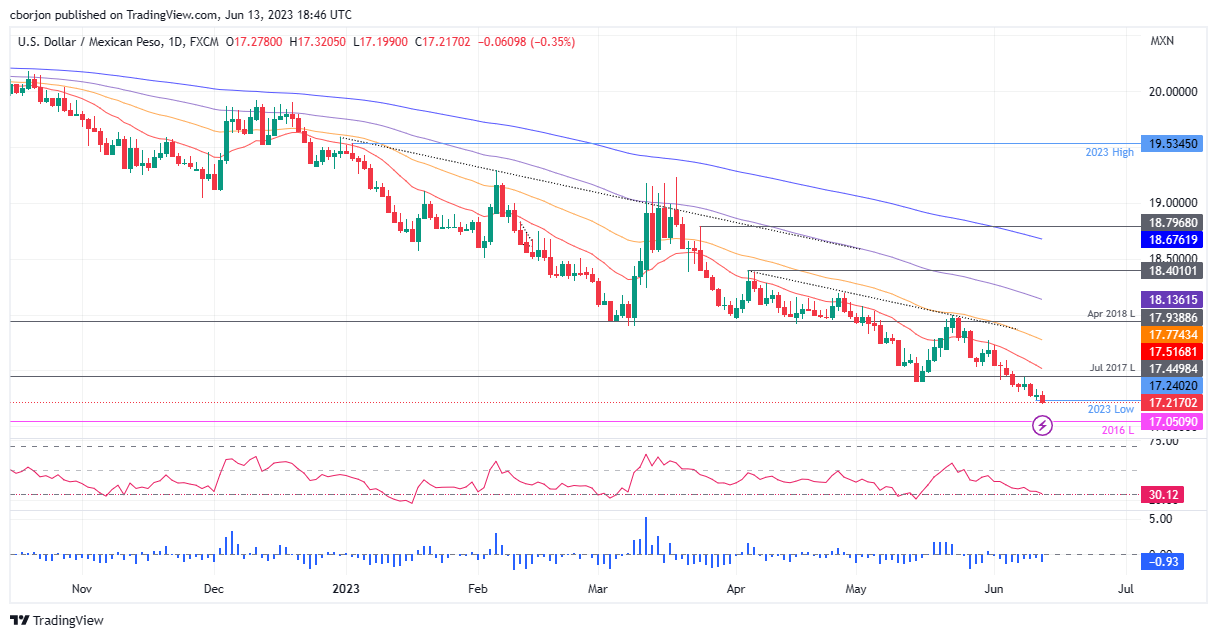
The USD/MXN is set to continue to drop further, pending decisively cracking the 17.2000 mark, albeit hitting a new YTD low of 17.1990. Though a daily close below the latter would send the USD/MXN plummeting toward the 2016 low of 17.0500 before challenging the 17.00 mark. Conversely, if USD/MXN pierces May’s low turned support at 17.4038, that could open the door for a recovery toward the 50-day Exponential Moving Average (EMA) at 17.5166.
Author

Christian Borjon Valencia
FXStreet
Markets analyst, news editor, and trading instructor with over 14 years of experience across FX, commodities, US equity indices, and global macro markets.


