USD/MXN collapses to 7-year lows despite risk-off sentiment in markets
- USD/MXN sinks to a seven-year low, influenced by the MXN’s favorable interest rate and Fed’s dovish stance.
- Despite USD/MXN decline, higher US Treasury bond yields hint at a potential Fed rate hike in July.
- A widened US trade deficit for April, driven by falling exports and rising imports, contributes to USD’s depreciation against the MXN.

USD/MXN collapsed to new seven-year lows on Wednesday, as the interest rate differential favors the Mexican Peso (MXN), while the US Dollar (USD) weakened on last week’s Fed dovish commentary ahead of the next week’s monetary policy meeting. Even though a risk-off impulse is present in the markets, the USD/MXN is trading at around 17.3600s after hitting a daily high of 17.3915.
Interest rate differential Favors the Mexican Peso; therefore, further USD/MXN downside expected
Sentiment remains deteriorated, as shown by US equities. Higher US Treasury bond yields cushion the USD/MXN from falling further, as investors bet the US Federal Reserve would hike rates in July after skipping the June meeting. The CME FedWatch Tool portrays odds for a 25-bps increase at 50.8%, at around the same level as yesterday.
Nevertheless, G10 central banks tightening monetary policy after skipping some rate-setting decisions keeps investors nervous about the Fed’s next move. During the last week, policymakers stressed that a pause is necessary to assess the impact of the cumulative tightening in the economy.
Data-wise, the US economic agenda featured the US Trade Balance, showing the deficit broadened in April, compared with March’s data. Numbers came at $-74.6B in April of 2023, vs. March’s $-60.B. A notable dip in exports contributed to this shift, while imports rose sharply
The greenback shifted positively; printing gains as shown by the US Dollar Index (DXY). The DXY, which tracks the USD performance against a basket of six currencies, pares its earlier losses, up 0.04%, at 104.078.
USD/MXN Price Analysis: Technical outlook
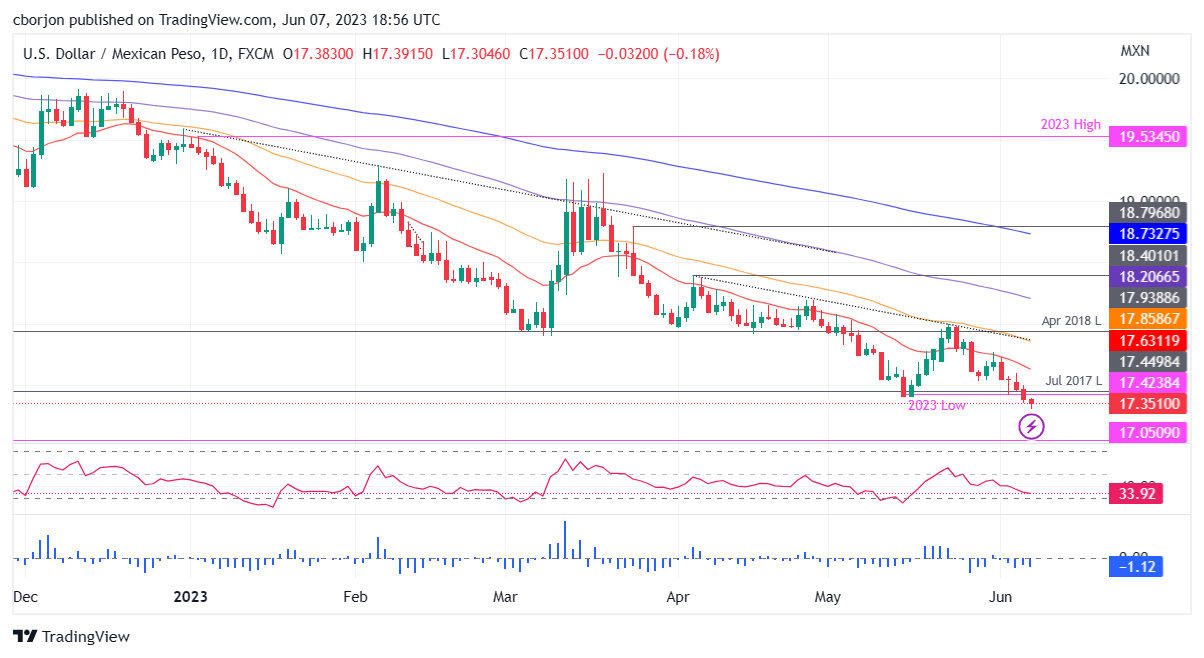
After testing the 17.99 on May 26, the USD/MXN plunged 3.50%, sponsored by overall MXN strength. Swing In market sentiment tempered the pair’s fall, but even comments that the Bank of Mexico would keep rates unchanged for two meetings was no excuse for the MXN to appreciate. Technical indicators like the Relative Strength Index (RSI) and the three-day Rate of Change (RoC) suggest that sellers remain in charge. That said, the USD/MXN next support would be the year-to-date (YTD) low of 17.3046. A breach of the latter will expose the 2016 low of 17.0500 before diving to 17.0000. Conversely, the USD/MXN first resistance would be the 20-day EMA at 17.6314, followed by the 50-day EMA at 17.8587.
Author

Christian Borjon Valencia
FXStreet
Markets analyst, news editor, and trading instructor with over 14 years of experience across FX, commodities, US equity indices, and global macro markets.


