USD/JPY Technical Analysis: US Dollar bulls en route to the December highs

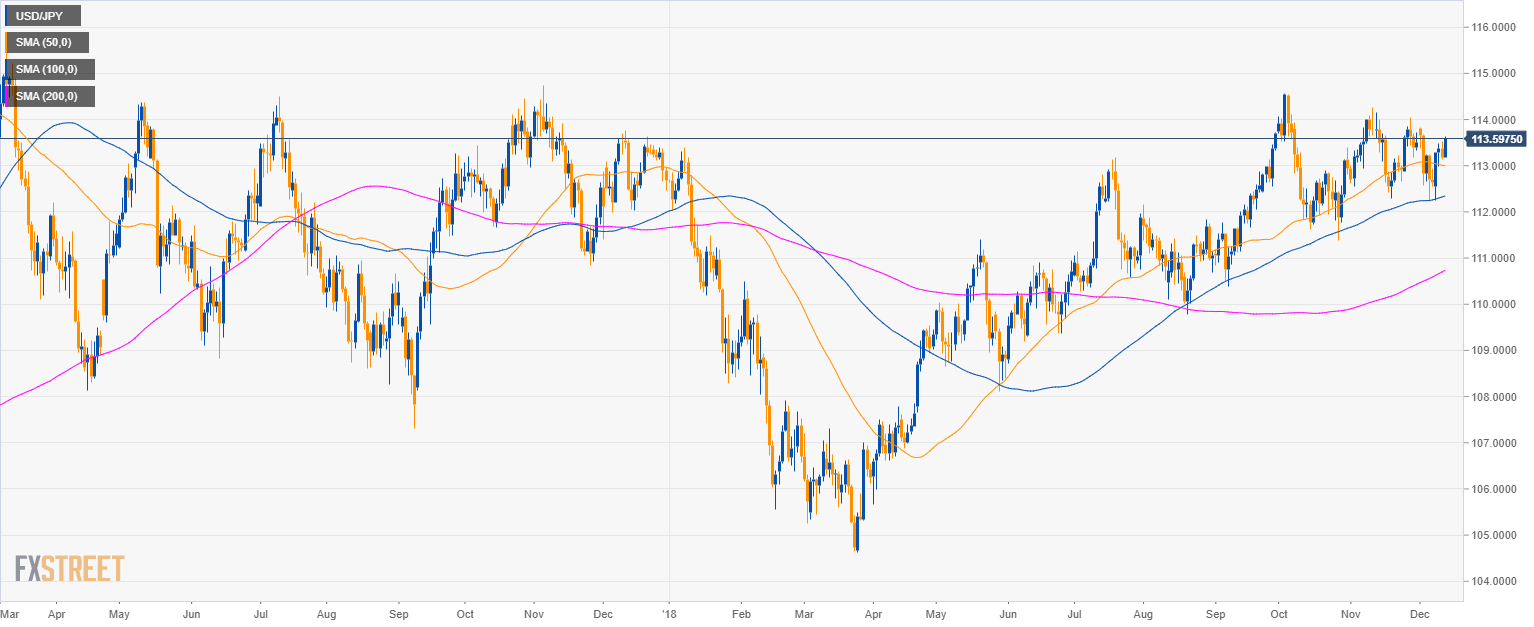
USD/JPY daily chart
- USD/JPY is trading in a bull trend above the 50, 100 and 200-day simple moving averages.
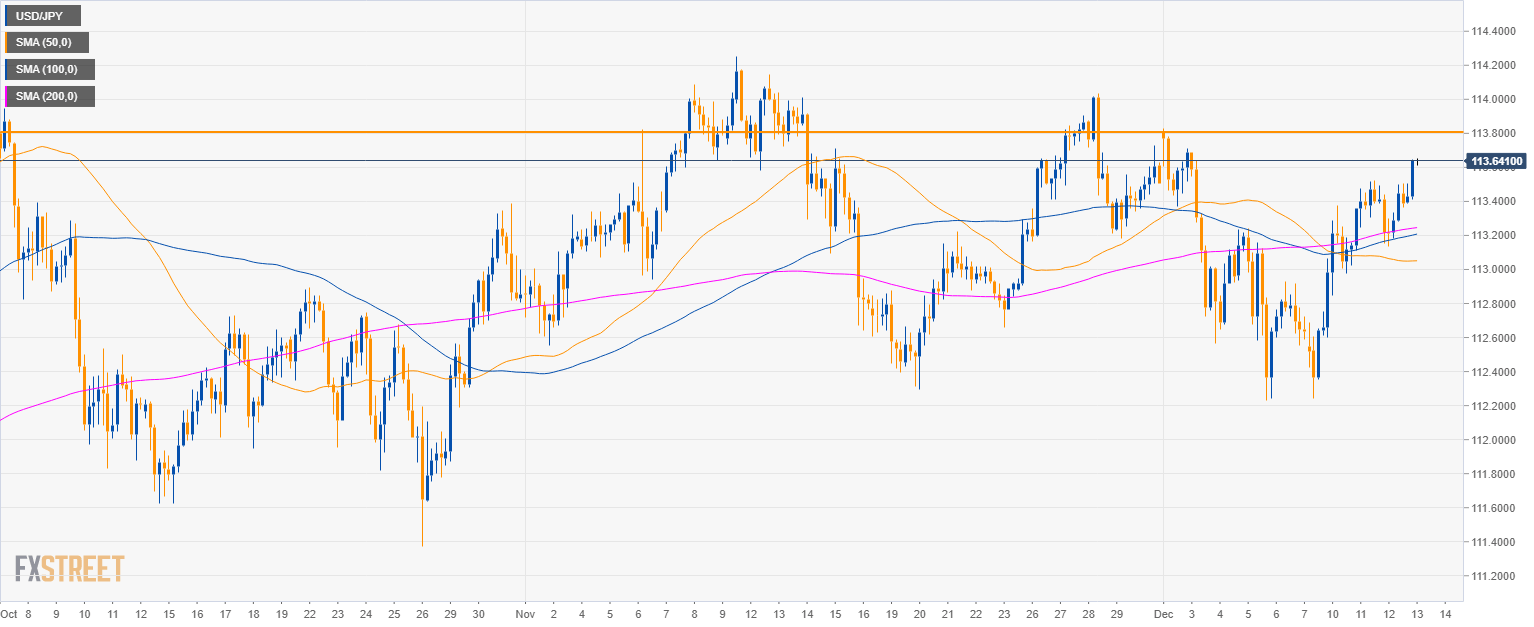
USD/JPY 4-hour chart
- USD/JPY is less than 20 pips away from the December high.
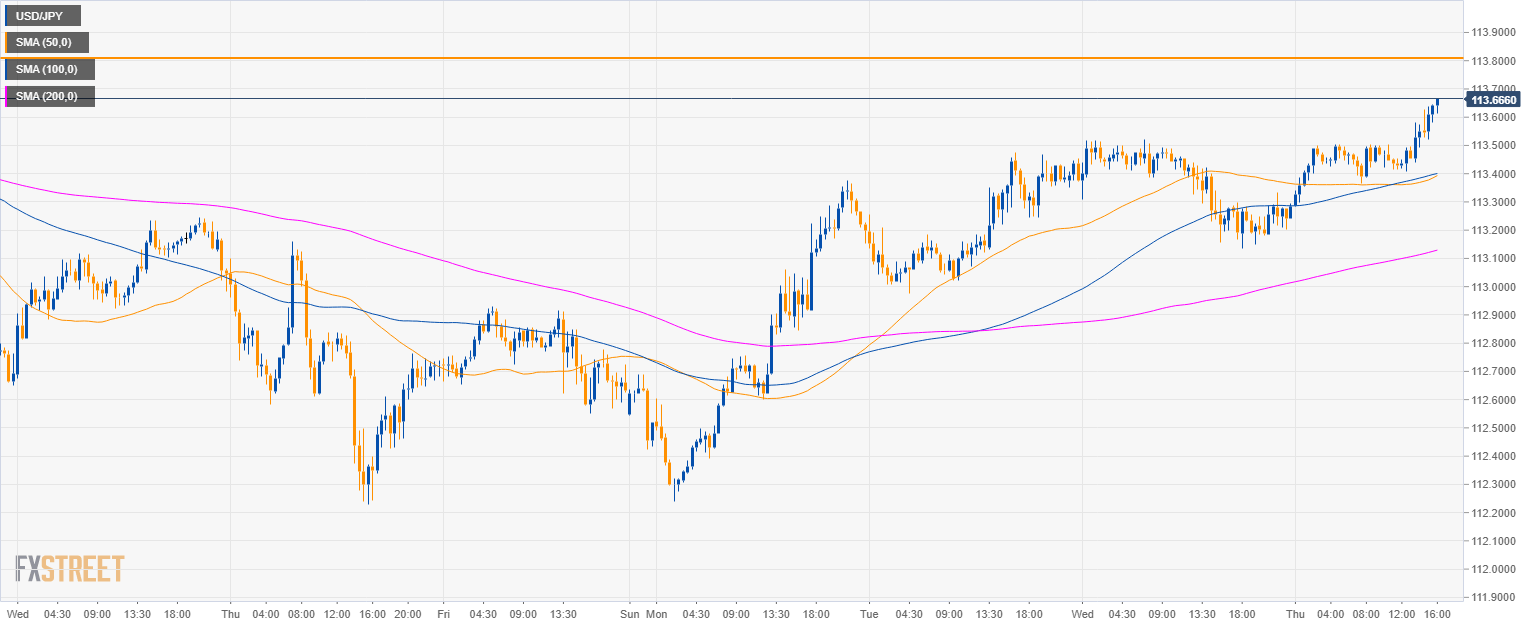
USD/JPY 30-minute chart
- USD/JPY is trading above its main SMAs.
- There is little that should prevent USD/JPY to test the December high.
Additional key levels
USD/JPY
Overview:
Today Last Price: 113.64
Today Daily change: 45 pips
Today Daily change %: 0.398%
Today Daily Open: 113.19
Trends:
Previous Daily SMA20: 113.17
Previous Daily SMA50: 113.01
Previous Daily SMA100: 112.33
Previous Daily SMA200: 110.69
Levels:
Previous Daily High: 113.52
Previous Daily Low: 113.14
Previous Weekly High: 113.83
Previous Weekly Low: 112.23
Previous Monthly High: 114.25
Previous Monthly Low: 112.3
Previous Daily Fibonacci 38.2%: 113.28
Previous Daily Fibonacci 61.8%: 113.37
Previous Daily Pivot Point S1: 113.04
Previous Daily Pivot Point S2: 112.9
Previous Daily Pivot Point S3: 112.66
Previous Daily Pivot Point R1: 113.43
Previous Daily Pivot Point R2: 113.67
Previous Daily Pivot Point R3: 113.81
Author

Flavio Tosti
Independent Analyst


