USD/JPY Technical Analysis: The Dollar's declines seeing bullish challenges
- The USD/JPY is trading cautiously near 112.75 in early Friday action after bouncing from the early day's bottom near 112.56, and the Dollar-Yen pairing is clipping back up today after dropping away from the 113.00 handle in the last twenty-four hours.

USD/JPY, M5
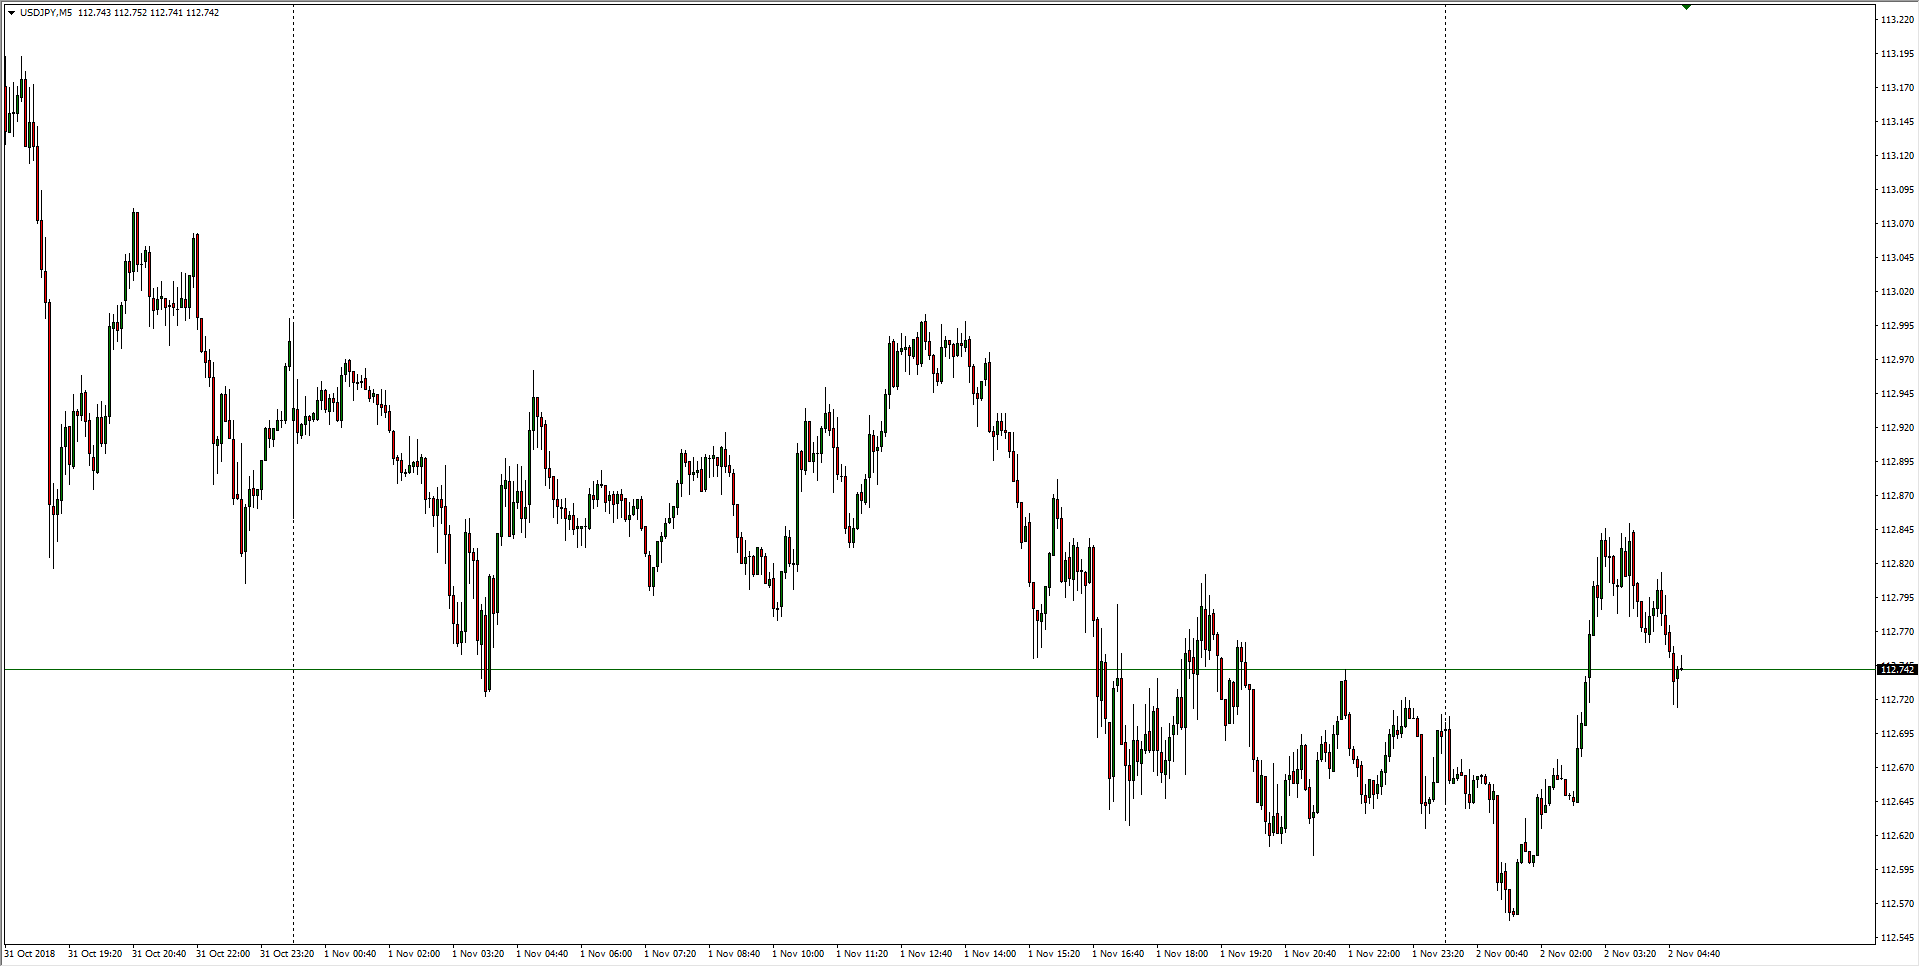
- The Dollar-Yen pairing is beginning to float back into the 200-hour moving average near 112.52, and today's action is seeing constraint from the 50-hour moving average at 112.80.
USD/JPY, H1
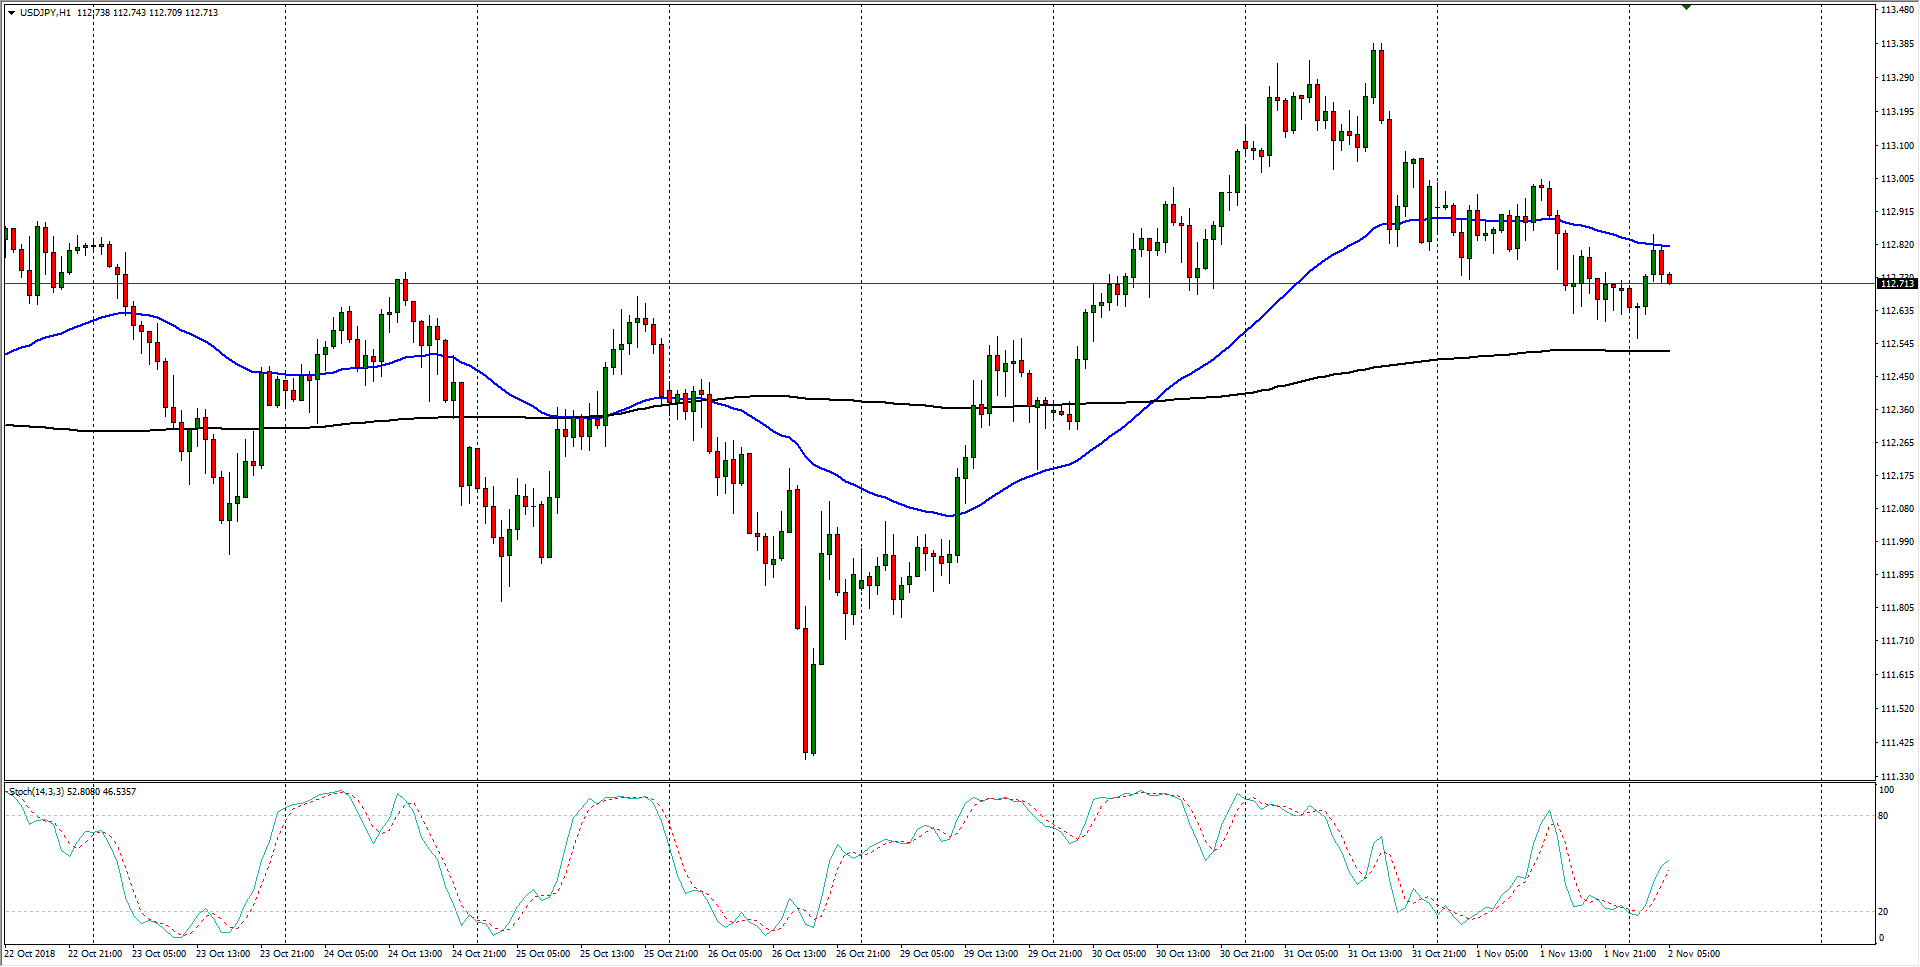
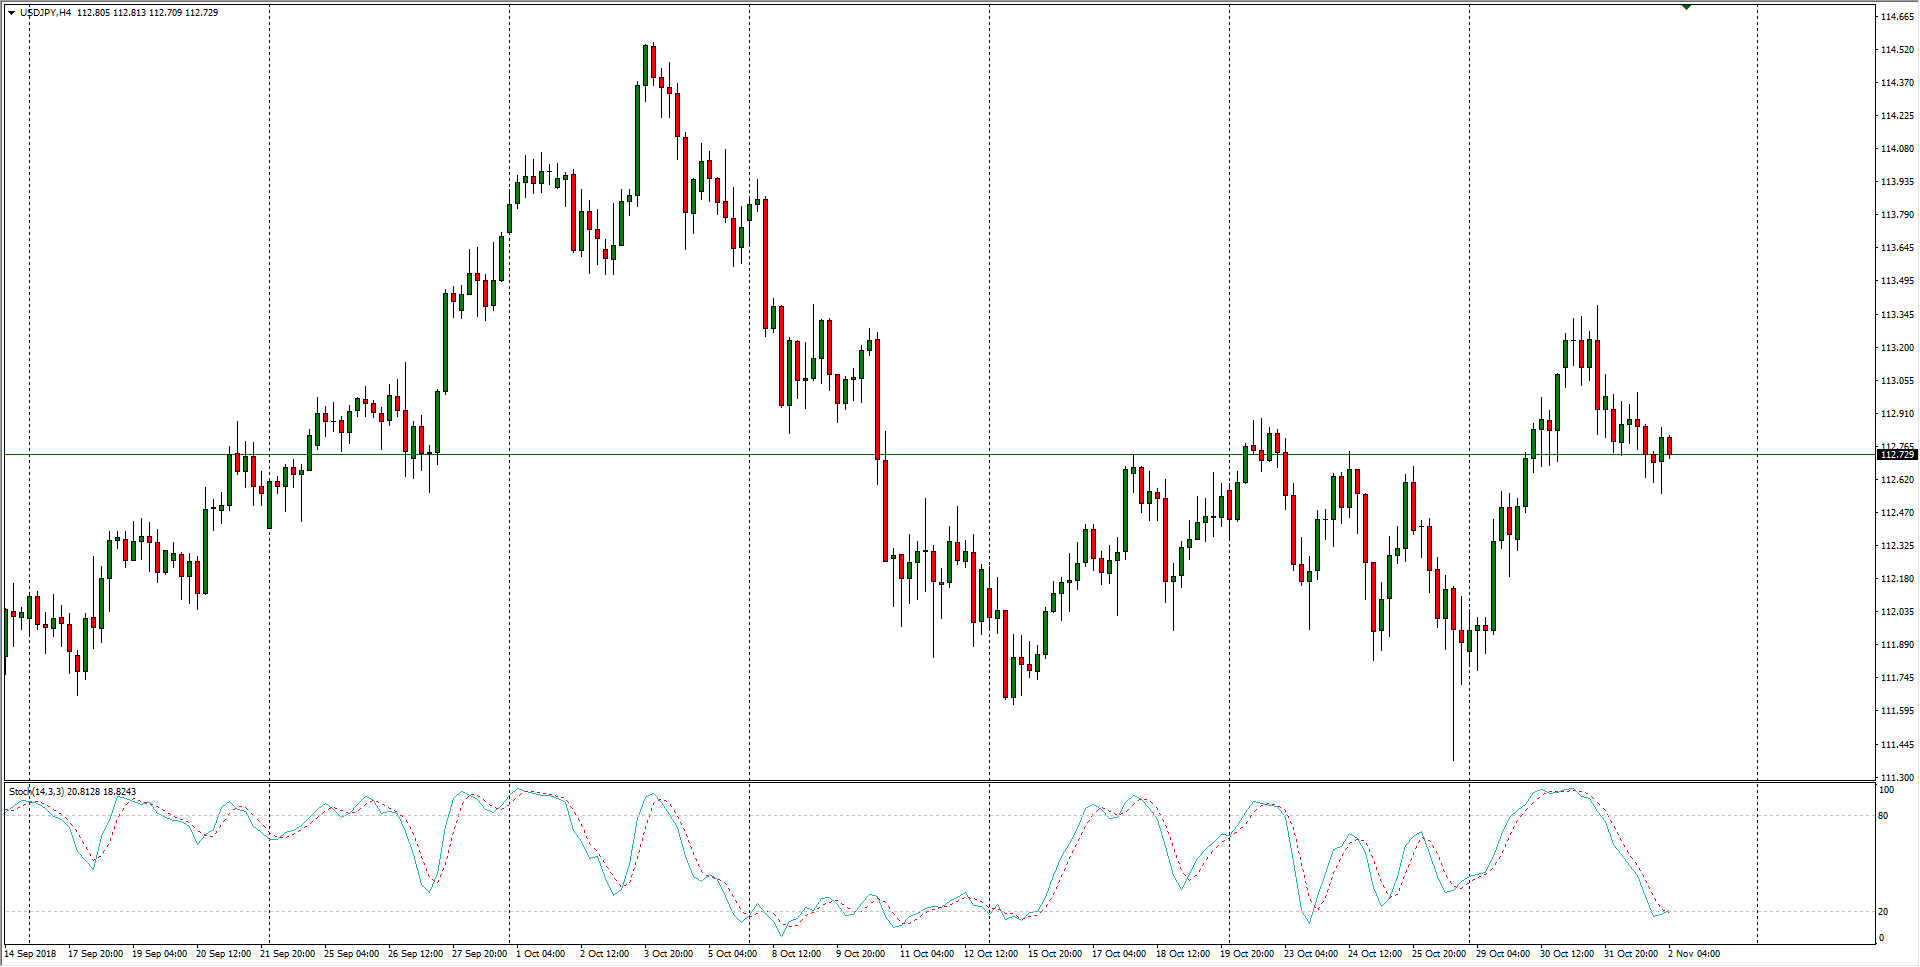
- This past week has seen the USD/JPY break out of recent consolidation, but the pair is drifting back into the top end of its previous zone, and a continued slide in the USD will see falling back into recent trappings.
USD/JPY, H4
USD/JPY
Overview:
Last Price: 112.74
Daily change: 3.0 pips
Daily change: 0.0266%
Daily Open: 112.71
Trends:
Daily SMA20: 112.55
Daily SMA50: 112.3
Daily SMA100: 111.67
Daily SMA200: 109.91
Levels:
Daily High: 113.06
Daily Low: 112.6
Weekly High: 112.9
Weekly Low: 111.38
Monthly High: 114.56
Monthly Low: 111.38
Daily Fibonacci 38.2%: 112.77
Daily Fibonacci 61.8%: 112.88
Daily Pivot Point S1: 112.52
Daily Pivot Point S2: 112.32
Daily Pivot Point S3: 112.05
Daily Pivot Point R1: 112.98
Daily Pivot Point R2: 113.26
Daily Pivot Point R3: 113.45
Author

Joshua Gibson
FXStreet
Joshua joins the FXStreet team as an Economics and Finance double major from Vancouver Island University with twelve years' experience as an independent trader focusing on technical analysis.


