USD/JPY technical analysis: Sellers look for entry below 108.00/107.95 confluence
- USD/JPY seesaw around the three-week low.
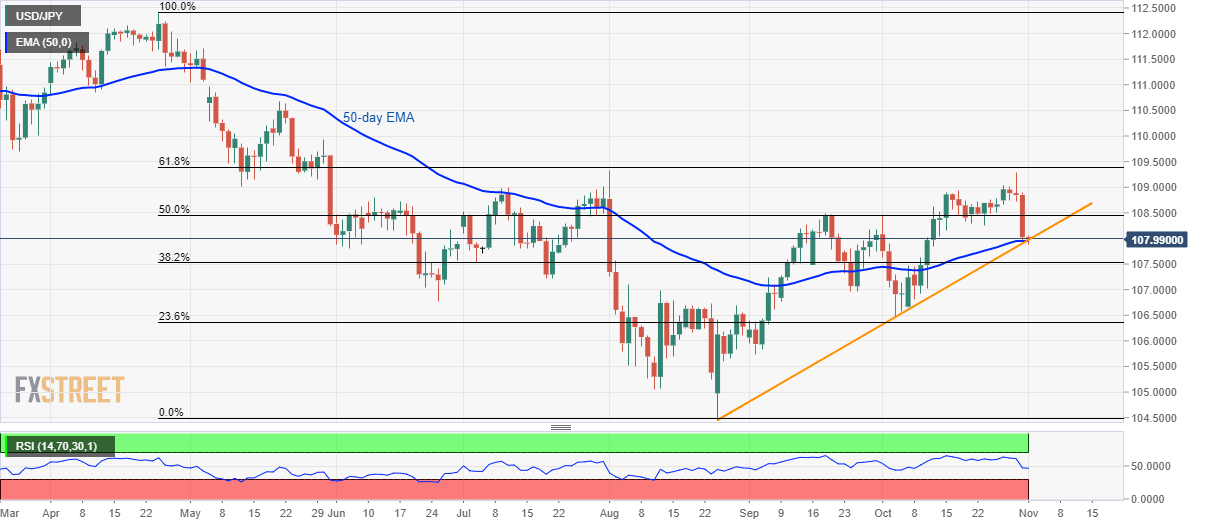
- 50-day EMA, rising trend line since late-August limit immediate declines.
- 61.8% Fibonacci retracement level seems the key resistance.

Despite declining to a three-week low, USD/JPY fails to extend the south-run as its nearness to the important technical indicators. The quote trades around 108.00 by the press time of pre-European session on Friday.
The pair needs to close beyond 107.95, comprising the lower-end of 50-day Exponential Moving Average (EMA) and medium-term rising support line, to extend its latest drop and revisit October month low nearing 106.50.
However, 38.2% Fibonacci retracement of April-August declines, at 107.52, can offer an intermediate halt during the downpour.
Alternatively, intra-day traders may keep looking for a bounce if prices increase over 50% Fibonacci retracement level of 108.45.
In doing so, the recent high around 109.30 and 61.8% Fibonacci retracement level of 109.40 will be their major challenges while aiming late-May high close to 110.70.
USD/JPY daily chart
Trend: pullback expected
Author

Anil Panchal
FXStreet
Anil Panchal has nearly 15 years of experience in tracking financial markets. With a keen interest in macroeconomics, Anil aptly tracks global news/updates and stays well-informed about the global financial moves and their implications.


