USD/JPY Technical Analysis: Multi-week-old rising trendline questions break of 61.8% Fibonacci
- USD/JPY steps back from a 17-week-old rising trend-line.
- 200-day SMA adds to the support.
- Bullish MACD highlights the May-end top on the upside break.

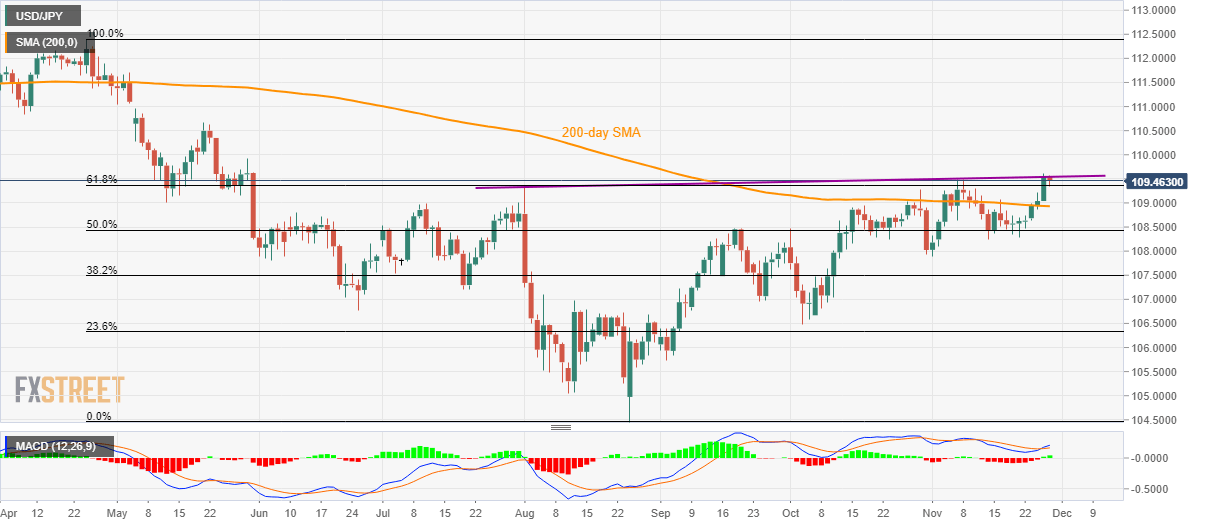
The USD/JPY pair pulls back to 109.45 at press time, with an upward sloping resistance line stopping it from extending its 61.8% Fibonacci retracement breakout. The quote pulls back to 109.45 by the press time of early Thursday.
Even so, 12-bar Moving Average Convergence and Divergence (MACD) questions the pair’s latest declines and hence an upside break of 109.55 trend line figure can propel it to the late-May top near 110.00.
It’s worth mentioning that May 21 high near 110.70 and April 10 low surrounding 110.85 could lure buyers beyond 110.00.
Meanwhile, sellers will look for entry below 61.8% Fibonacci retracement of its April-August declines, at 109.35, which in turn will highlight the 200-day Simple Moving Average (SMA) level of 108.93.
In a case where prices keep trading southwards past-108.93, 50% Fibonacci retracement and the monthly low, surrounding 108.40 and 107.90 respectively, should become bears’ favorites.
USD/JPY daily chart
Trend: Pullback expected
Author

Anil Panchal
FXStreet
Anil Panchal has nearly 15 years of experience in tracking financial markets. With a keen interest in macroeconomics, Anil aptly tracks global news/updates and stays well-informed about the global financial moves and their implications.


