USD/JPY Technical Analysis: Greenback turning bearish below 110.70 key level

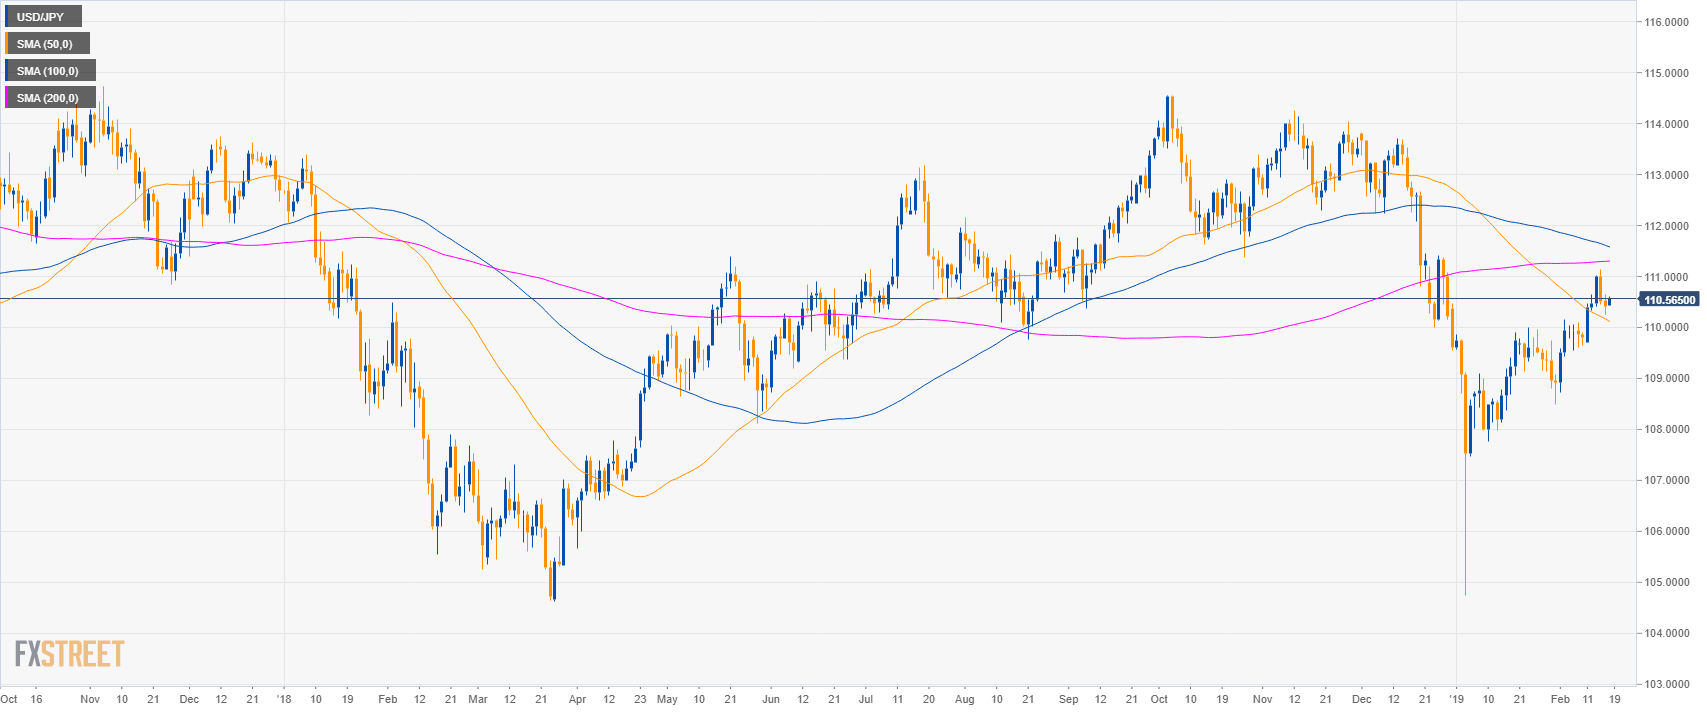
USD/JPY daily chart
- USD/JPY is trading in a deep pullback below the 200-day simple moving averages (SMAs) on the daily chart.
- This Monday, on US President’s Day, the financial markets might offer limited moves.
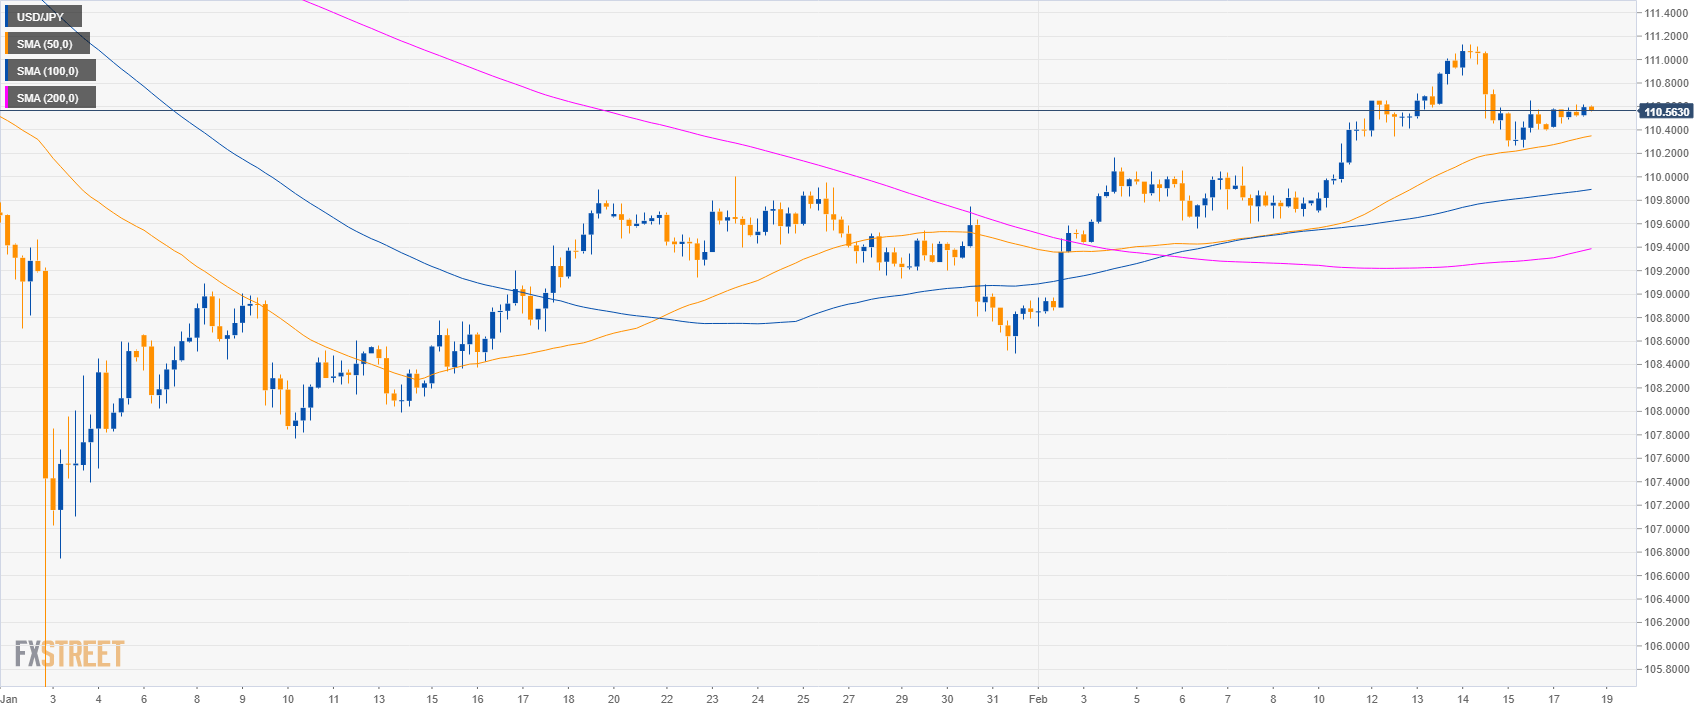
USD/JPY 4-hour chart
- USD/JPY is trading above its main SMAs suggesting bullish momentum.
USD/JPY 30-minute chart
- USD/JPY is capped by 110.70 and the 200 SMA suggesting a decline in price in the coming sessions.
- Supports to the downside are seen near 110.30 and 109.80 level.
- On the flip side, a strong breakout above 110.70 key level would invalidate the bearish scenario and would see the 111.00 level revisited.

Additional key levels
USD/JPY
Overview:
Today Last Price: 110.57
Today Daily change: 17 pips
Today Daily change %: 0.15%
Today Daily Open: 110.4
Trends:
Daily SMA20: 109.81
Daily SMA50: 110.17
Daily SMA100: 111.61
Daily SMA200: 111.3
Levels:
Previous Daily High: 110.65
Previous Daily Low: 110.25
Previous Weekly High: 111.13
Previous Weekly Low: 109.7
Previous Monthly High: 110
Previous Monthly Low: 104.75
Daily Fibonacci 38.2%: 110.4
Daily Fibonacci 61.8%: 110.5
Daily Pivot Point S1: 110.22
Daily Pivot Point S2: 110.04
Daily Pivot Point S3: 109.83
Daily Pivot Point R1: 110.62
Daily Pivot Point R2: 110.83
Daily Pivot Point R3: 111.01
Author

Flavio Tosti
Independent Analyst


