|
USD/JPY technical analysis: Greenback supported above the 107.00 handle
- USD/JPY is in correcting up as the market is supported above 107.00.
- The level to beat for bulls is 107.70 followed by 108.25 resistance.

USD/JPY daily chart
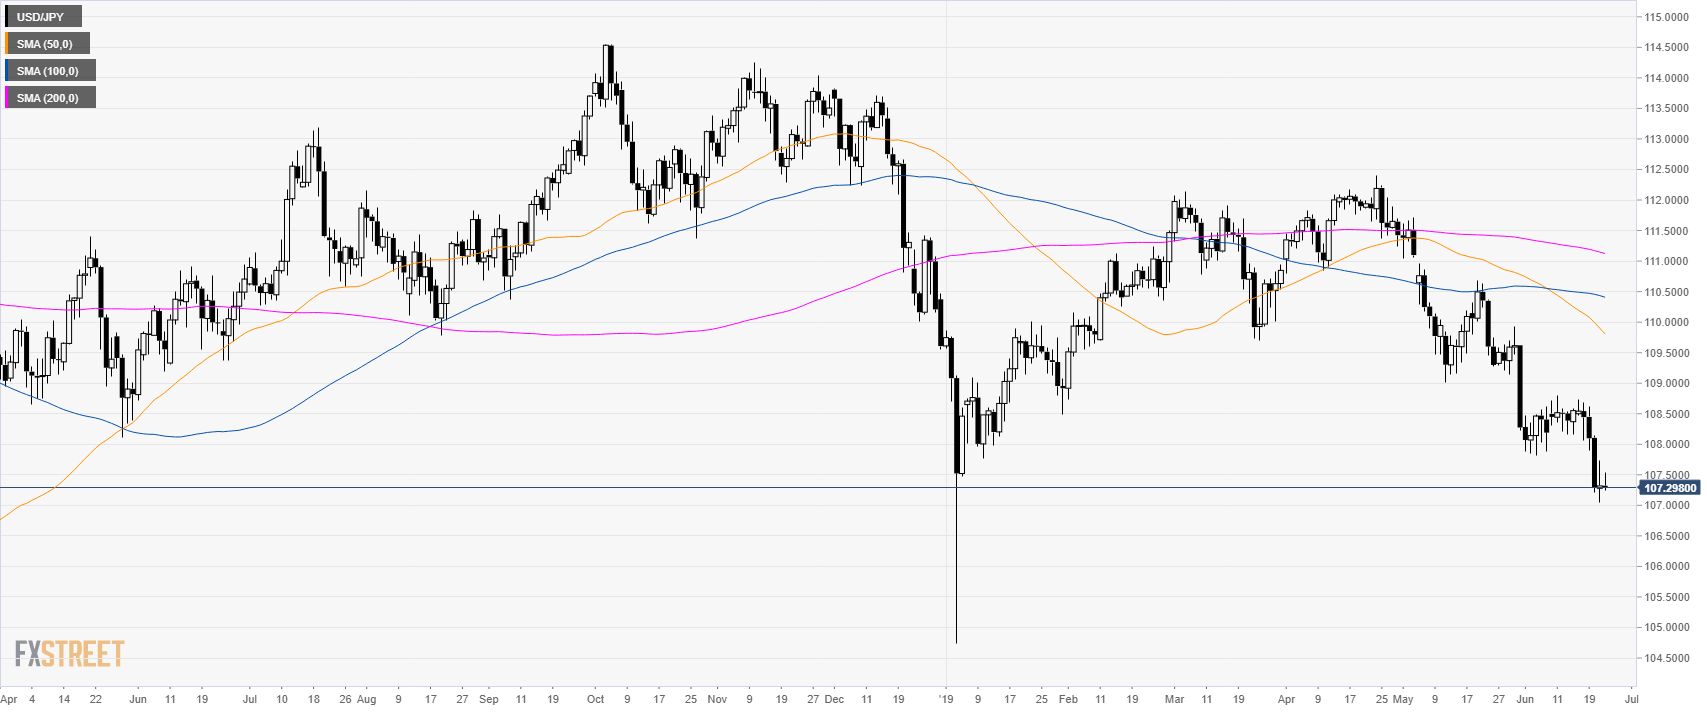
USD/JPY is trading in a bear trend below its main daily simple moving averages (DSMAs). The 50 DSMA crossed below the 100 DSMA which can be interpreted as bearish. USD/JPY almost reached the 107.00 figure.

USD/JPY 4-hour chart
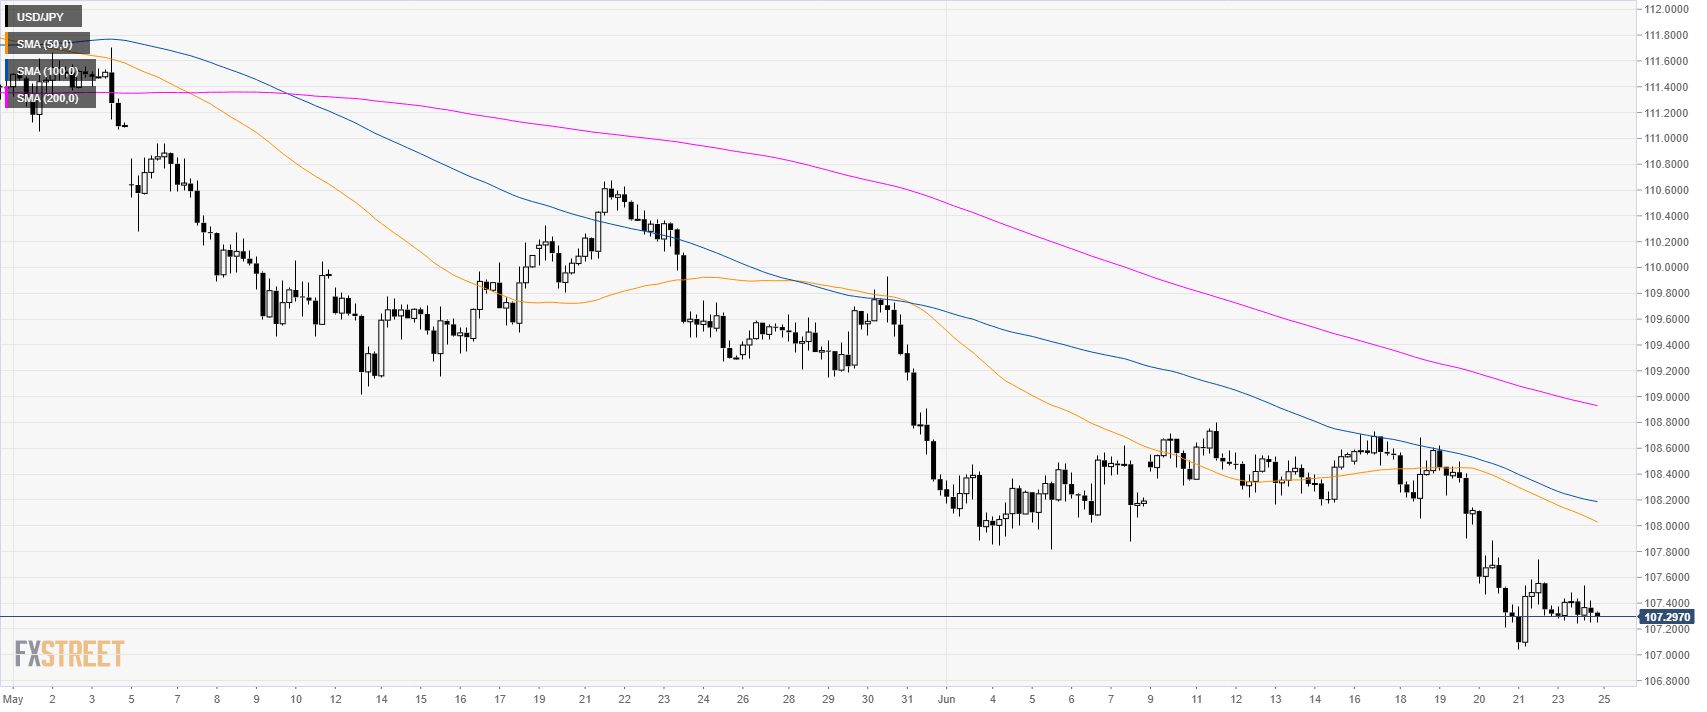
USD/JPY below its main SMAs suggesting bearish momentum in the medium term. Last week, the market found support near the 107.00 figure and is now in a correction up.
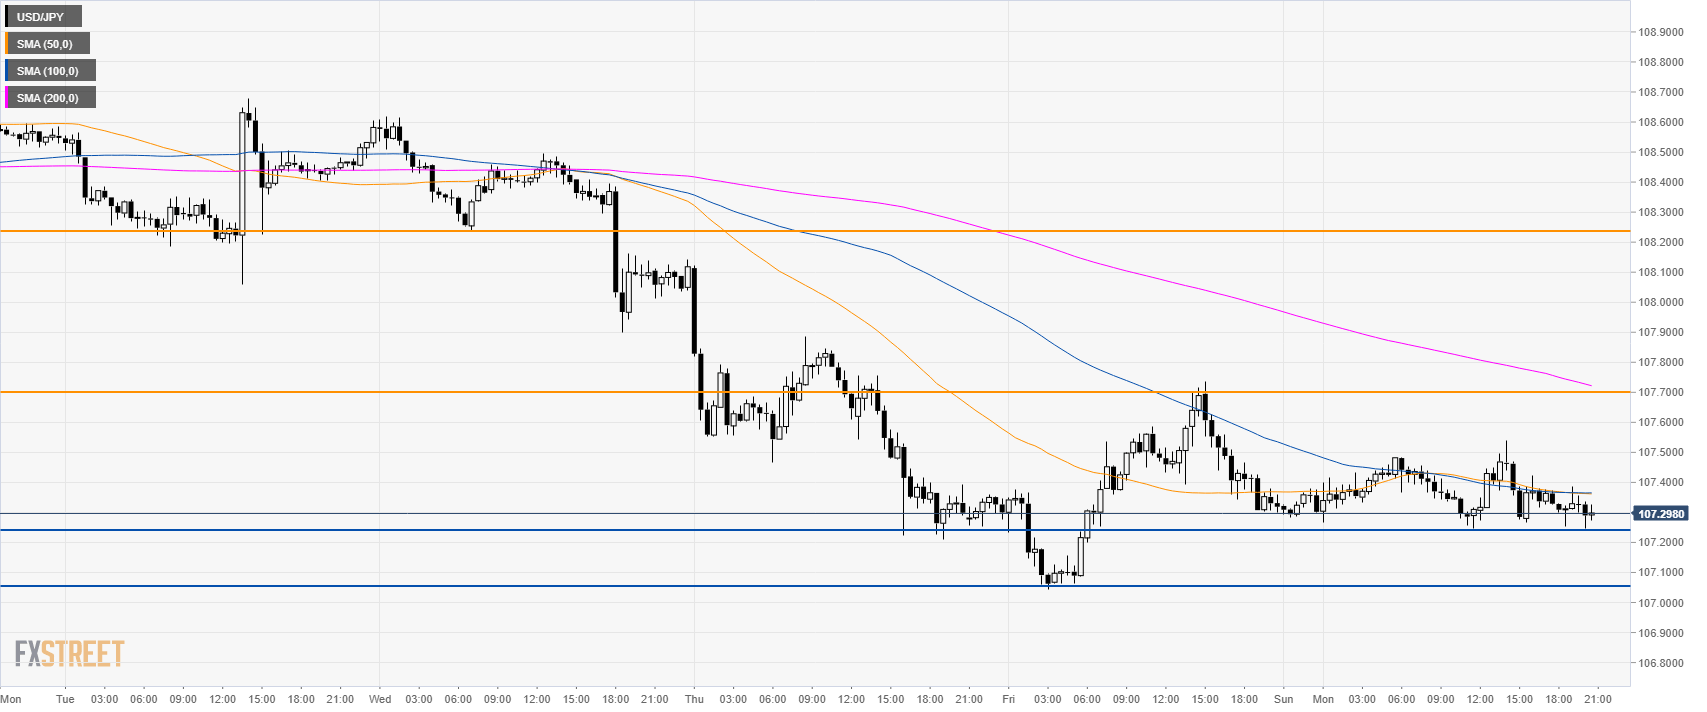
USD/JPY 30-minute chart
A break above 107.70 (current Friday high) could open the doors to 108.25 strong resistance according to the Technical Confluences Indicator. Alternatively, a break below 107.00 on a daily closing basis can see the main bear trend resuming and open the gates for a potential drop to 106.00 figure.

Additional key levels
Author

Flavio Tosti
Independent Analyst
More from Flavio Tosti


