|
USD/JPY Technical Analysis: Greenback quiet near 112.00 figure against Yen

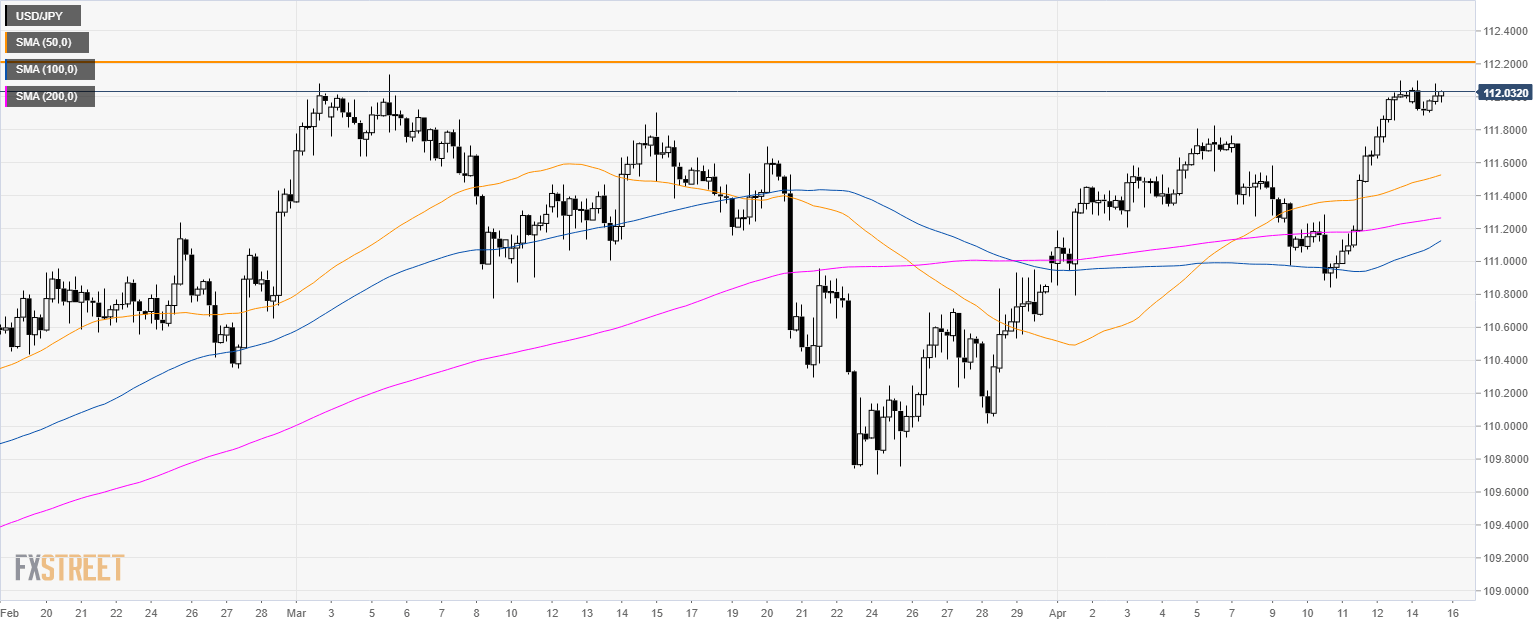
USD/JPY daily chart
- USD/JPY is trading above its 200-day simple moving average (SMA).

USD/JPY 4-hour chart
- USD/JPY will need to break the 112.20 key resistance.
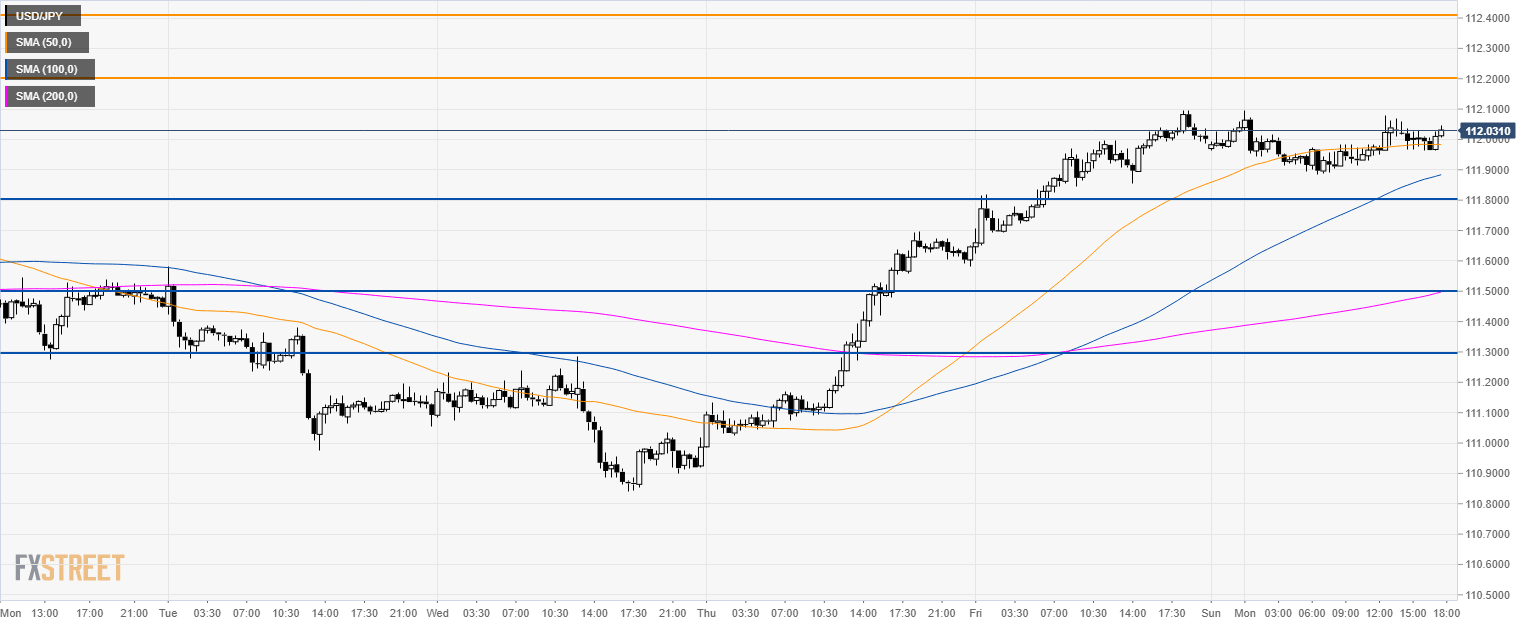
USD/JPY 30-minute chart
- USD/JPY is trading above its main SMAs suggesting bullish momentum in the short-term.
- A break of 112.20 is needed to for the market to jump to 112.40 resistance.
- To the downside, support is seen at 111.80 and 111.50 level.
Additional key levels
Author

Flavio Tosti
Independent Analyst
More from Flavio Tosti


