|

USD/JPY Technical Analysis: Greenback hammered down 112.20 as Wall Street bears own the market - 112.60 bull target
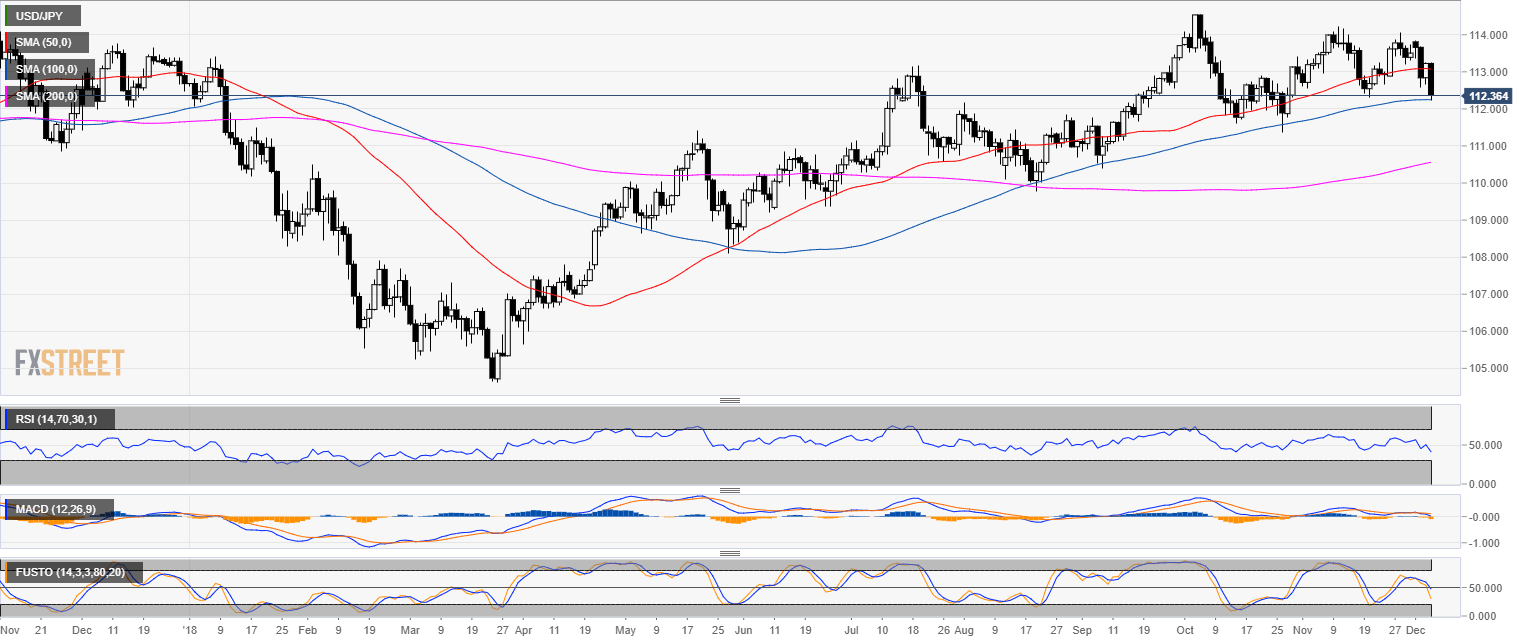
USD/JPY daily chart

  • USD/JPY is in a bull trend above the 200-day simple moving average (SMA).
  • USD/JPY found some support at the 100 SMA. 
  • Safe haven Yen was in demand as US indices are trading down.

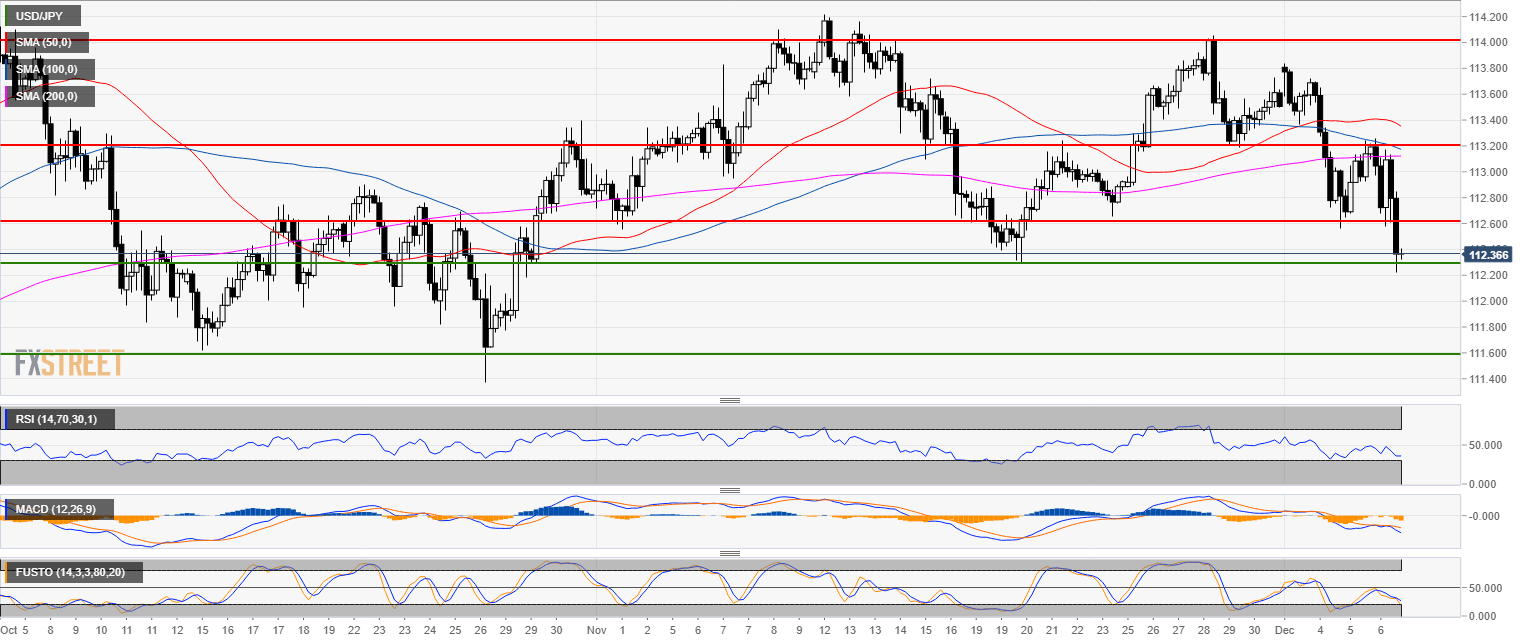
USD/JPY 4-hour chart

  • USD/JPY is trading below its main SMAs. 
  • USD/JPY is testing November lows at the 112.20 level. 

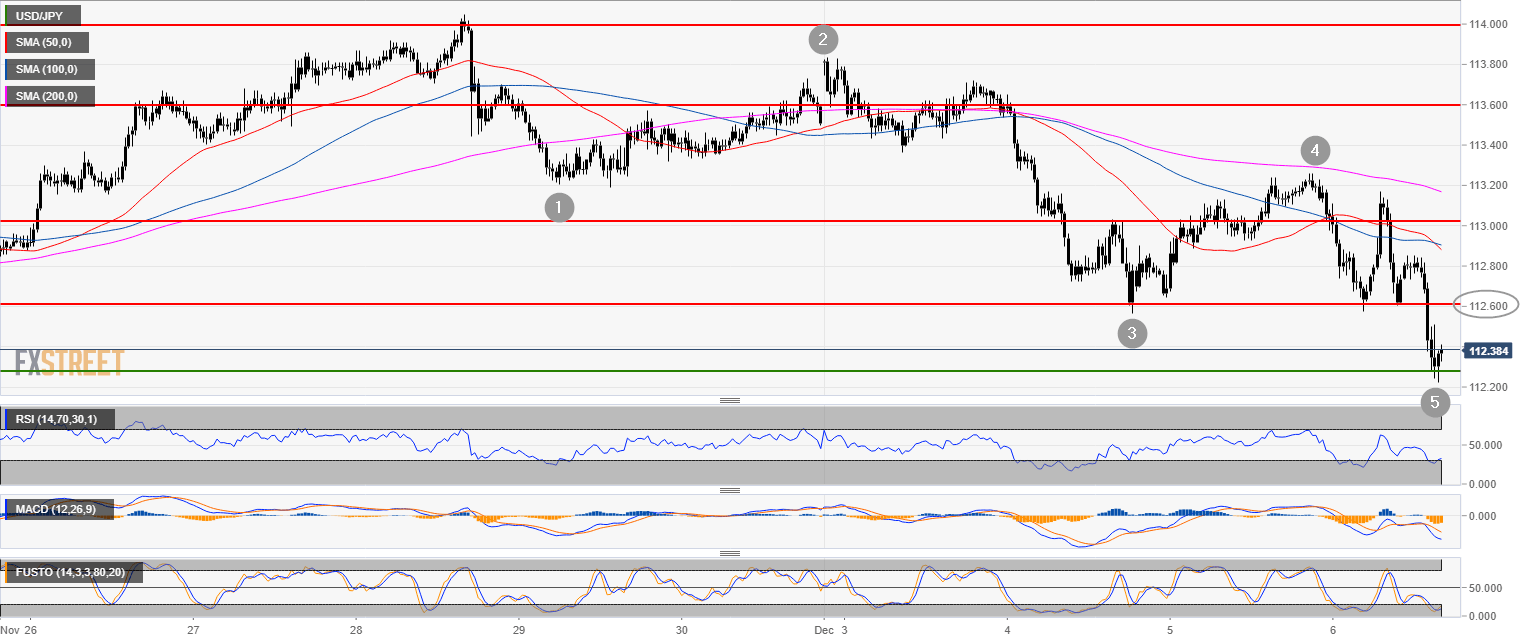
USD/JPY 30-minute chart

  • As USD/JPY created a 5-wave pattern, bulls might find support at 112.20. 
  • The next bullish target is seen at 112.60. 

Additional key levels

USD/JPY

Overview:
    Today Last Price: 112.36
    Today Daily change: -86 pips
    Today Daily change %: -0.760%
    Today Daily Open: 113.22
Trends:
    Previous Daily SMA20: 113.35
    Previous Daily SMA50: 113.09
    Previous Daily SMA100: 112.25
    Previous Daily SMA200: 110.52
Levels:
    Previous Daily High: 113.24
    Previous Daily Low: 112.65
    Previous Weekly High: 114.04
    Previous Weekly Low: 112.88
    Previous Monthly High: 114.25
    Previous Monthly Low: 112.3
    Previous Daily Fibonacci 38.2%: 113.02
    Previous Daily Fibonacci 61.8%: 112.88
    Previous Daily Pivot Point S1: 112.83
    Previous Daily Pivot Point S2: 112.44
    Previous Daily Pivot Point S3: 112.24
    Previous Daily Pivot Point R1: 113.43
    Previous Daily Pivot Point R2: 113.63
    Previous Daily Pivot Point R3: 114.02

Author

Flavio Tosti

Flavio Tosti

Independent Analyst


More from Flavio Tosti
Share:

Editor's Picks

EUR/USD flirts with yearly lows in the sub-1.1600 area

EUR/USD adds to Monday’s heavy losses and breaks below the key 1.1600 support on Tuesday, putting the YTD lows around 1.1570 to the test. The pair’s deep pullback comes as the US Dollar extend its strong bounce, always propped up by the intense  flight-to-safety environment.

GBP/USD attacks 1.3300, refreshing three-month lows

GBP/USD is deep in the red near 1.3300, accelerating its downside to renew three-month lows in European trading on Tuesday. The ongoing escalation in the Iran war, combined with rising Oil prices, weighs negatively on the higher-yielding Pound Sterling as the US Dollar capitalizes on increased haven demand.

Gold remains offered around $5,170

Gold comes under renewed and marked selling pressure on Tuesday, hovering around the $5,170 mark per troy ounce and reversing four consecutive daily advances. The yellow metal’s bearish tone comes on the back of the increasing demand for the Greenback at the time when investors continue to trim bets on further Fed rate cuts.

Crypto Today: Bitcoin, Ethereum, XRP pull back as sentiment remains in extreme market fear

The cryptocurrency market is broadly in the red on Tuesday as the Middle East grapples with an escalating war. Bitcoin (BTC) is in a pullback, trading below $67,000 at the time of writing, and most altcoins follow suit.

Middle East conflict ramps up a gear as energy price spike rips through markets

It’s another risk off day as geopolitical headwinds continue to batter financial markets. Although markets calmed during the US session and US stocks managed to post gains on Monday, this has not fed through to the European session, and stocks and bonds are sharply lower for a second day.

Hyperliquid Price Forecast: HYPE rises on commodities demand amid US-Iran war

Hyperliquid (HYPE) steadies above $33 at press time on Tuesday, marking its fourth consecutive day of recovery in a broadly volatile market due to the ongoing US-Israel strikes on Iran.