USD/JPY Technical Analysis: Greenback bulls keep the market above the 108.00 figure

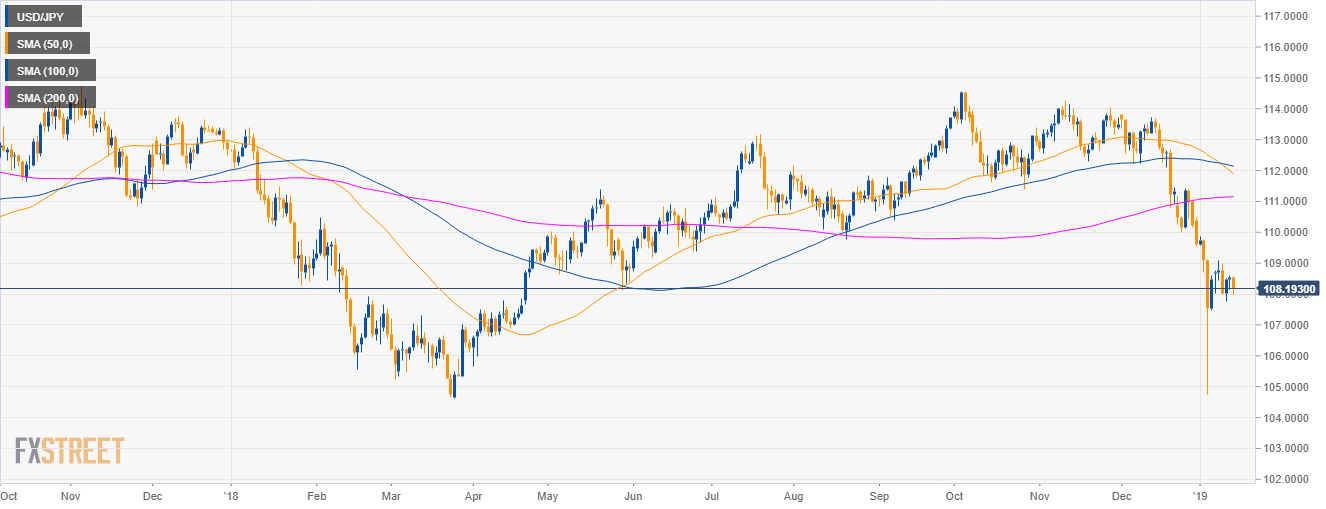
USD/JPY daily chart
- USD/JPY is in a deep pullback below the 50, 100 and 200-period simple moving averages (SMAs).
- Bulls are keeping the market above the 108.00 figure despite bearish pressure.
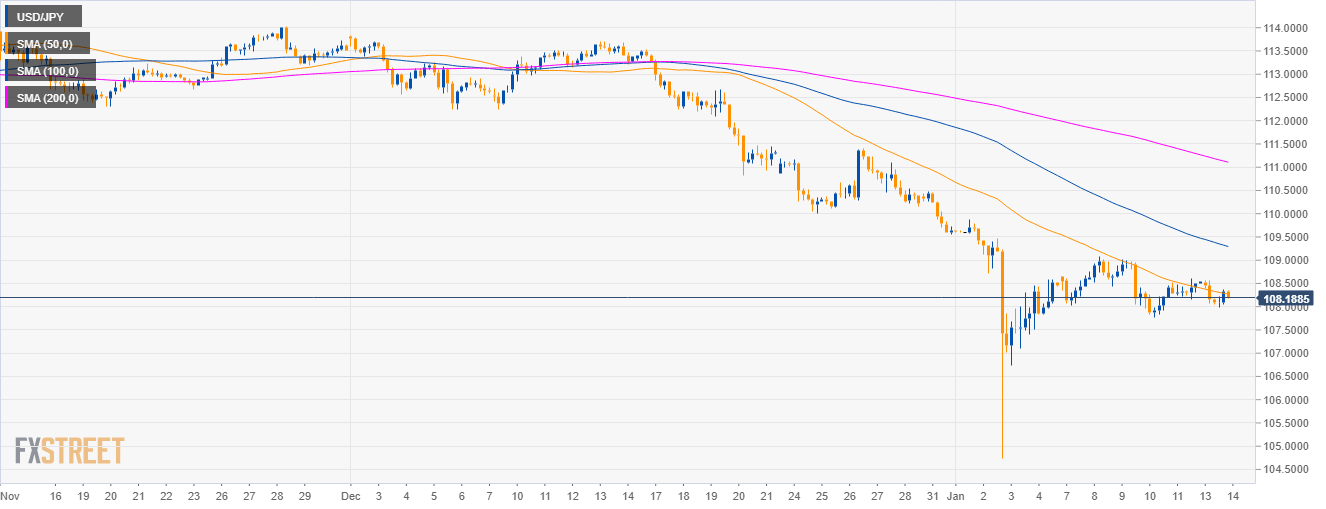
USD/JPY 4-hour chart
- The 50 SMA is acting as dynamic resistance.
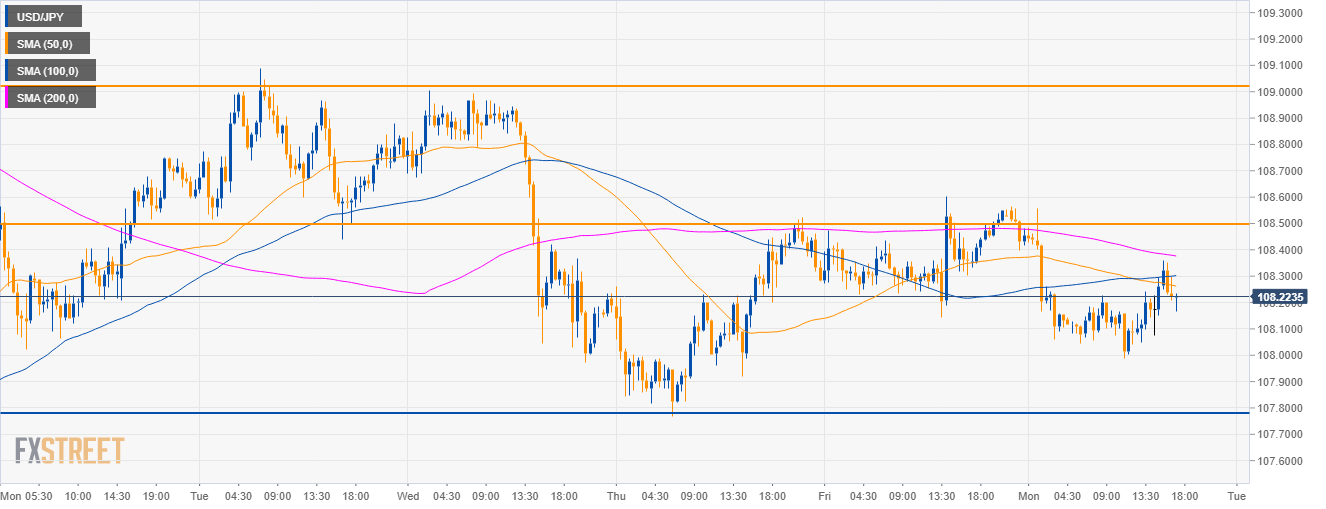
USD/JPY 30-minute chart
- USD/JPY is trading in a tight range.
- Bulls will most likely try to reconquer the 108.50 level to the upside in the short-term.
- Support lies at the 107.80 level.
Additional key levels
USD/JPY
Overview:
Today Last Price: 108.2
Today Daily change: -35 pips
Today Daily change %: -0.322%
Today Daily Open: 108.55
Trends:
Previous Daily SMA20: 110.03
Previous Daily SMA50: 112
Previous Daily SMA100: 112.17
Previous Daily SMA200: 111.14
Levels:
Previous Daily High: 108.6
Previous Daily Low: 108.14
Previous Weekly High: 109.09
Previous Weekly Low: 107.77
Previous Monthly High: 113.83
Previous Monthly Low: 109.55
Previous Daily Fibonacci 38.2%: 108.43
Previous Daily Fibonacci 61.8%: 108.32
Previous Daily Pivot Point S1: 108.26
Previous Daily Pivot Point S2: 107.97
Previous Daily Pivot Point S3: 107.8
Previous Daily Pivot Point R1: 108.72
Previous Daily Pivot Point R2: 108.89
Previous Daily Pivot Point R3: 109.18
Author

Flavio Tosti
Independent Analyst


