USD/JPY Technical Analysis: A break above 113.70 resistance can open the gates to the December high

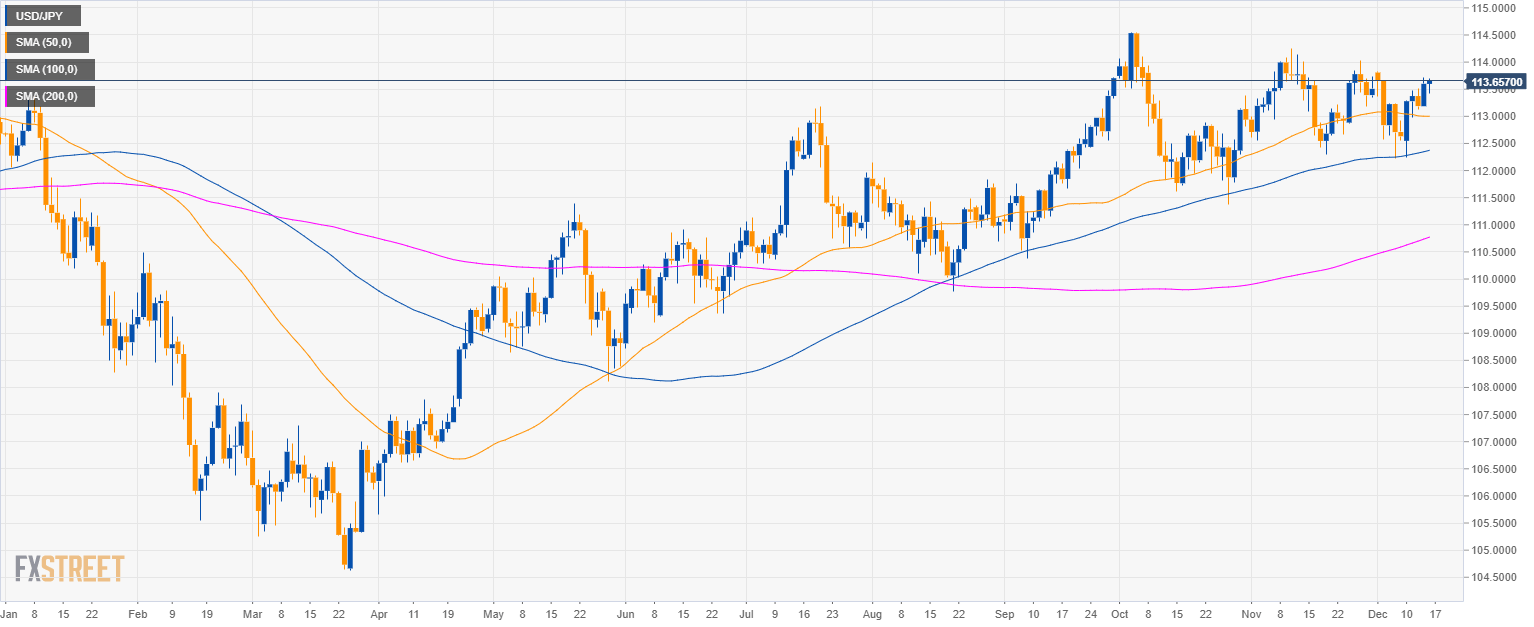
USD/JPY daily chart
- USD/JPY is trading in a bull trend above the 50, 100 and 200-day simple moving averages (SMAs).
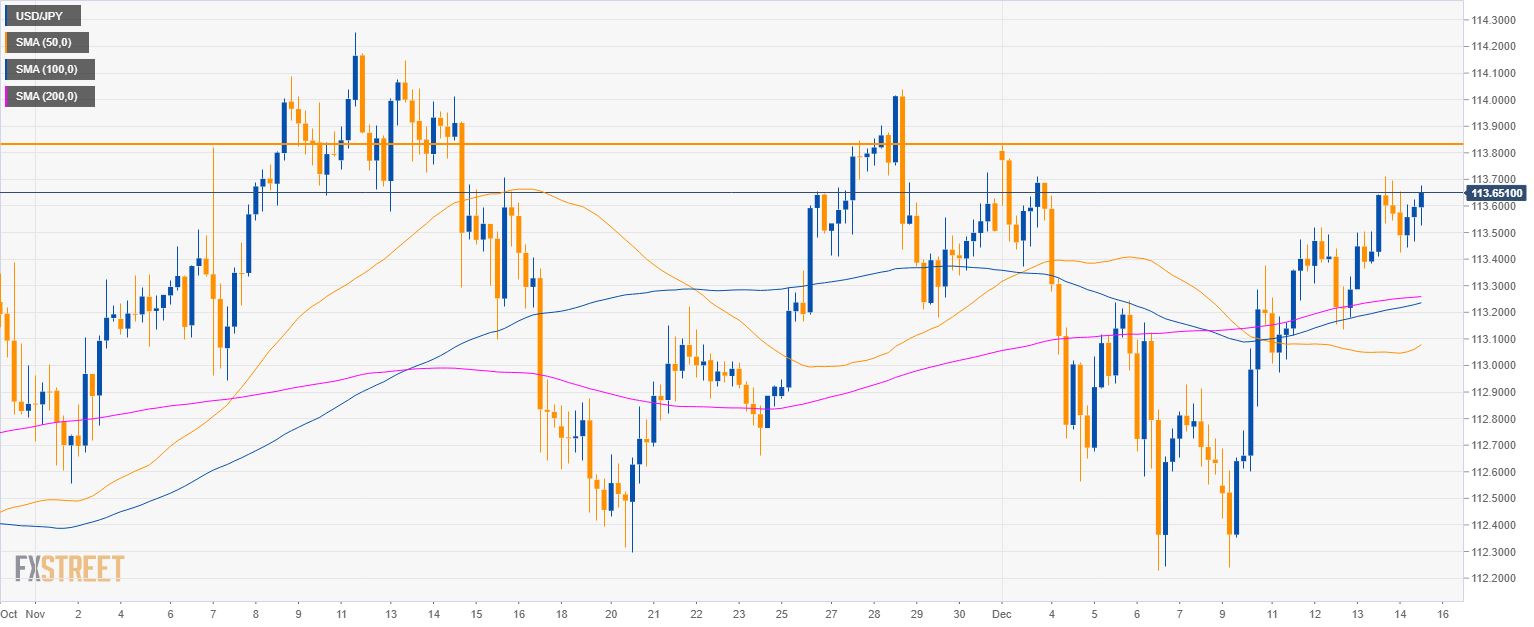
USD/JPY 4-hour chart
- USD/JPY is about 20 pips away from the December high.
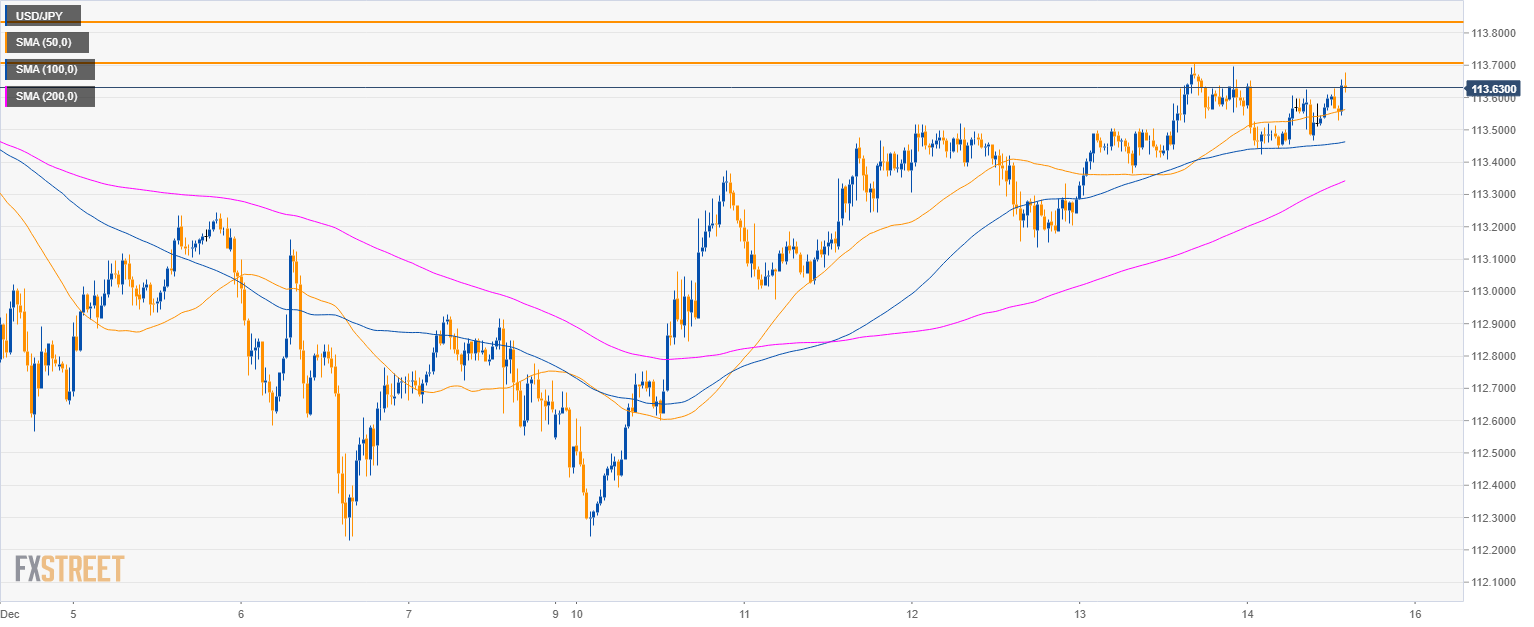
USD/JPY 30-minute chart
- On lower time-frames, USD/JPY is trading in a bull trend above its main SMAs.
- The level to beat for bulls is 113.70 resistance. If broken to the upside then 113.82 (December high) is most likely on the cards.
Additional key levels
USD/JPY
Overview:
Today Last Price: 113.64
Today Daily change: 4.0 pips
Today Daily change %: 0.0352%
Today Daily Open: 113.6
Trends:
Previous Daily SMA20: 113.17
Previous Daily SMA50: 113
Previous Daily SMA100: 112.35
Previous Daily SMA200: 110.72
Levels:
Previous Daily High: 113.71
Previous Daily Low: 113.18
Previous Weekly High: 113.83
Previous Weekly Low: 112.23
Previous Monthly High: 114.25
Previous Monthly Low: 112.3
Previous Daily Fibonacci 38.2%: 113.51
Previous Daily Fibonacci 61.8%: 113.39
Previous Daily Pivot Point S1: 113.29
Previous Daily Pivot Point S2: 112.97
Previous Daily Pivot Point S3: 112.76
Previous Daily Pivot Point R1: 113.81
Previous Daily Pivot Point R2: 114.02
Previous Daily Pivot Point R3: 114.34
Author

Flavio Tosti
Independent Analyst


