USD/JPY struggles as US Dollar Softens Ahead of Key Trade Talks
- USD/JPY trades near 145.00 after failing to hold gains above 146.20, pressured by a softer US Dollar and mixed US data.
- Japan’s March Overall Household Spending rose 2.10% y/y, beating expectations, while US stagflation risks linger as Fed officials warn of persistent inflation.
- Key technical levels include support at 144.82, 144.79, and 144.49, with resistance at 146.16, 146.31, and 148.30.

USD/JPY pair has pulled back toward 145.00 after failing to extend gains above a near one-month high of 146.20 earlier in the day. The retreat reflects a broader softening in the US Dollar, which reversed sharply as investors reassessed the US-UK trade deal and looked ahead to critical US-China negotiations this weekend in Switzerland. The US Dollar Index (DXY), which measures the value of the USD against six major currencies, fell to 100.30 after peaking at 100.86, reflecting growing market skepticism over the strength of recent US trade agreements.
The US economic outlook remains mixed, with Fed officials highlighting the risk of stagflation. Governor Barr recently noted that higher tariffs could disrupt global supply chains, pushing up inflation while potentially slowing economic growth and raising unemployment. Despite this, the Atlanta Fed GDPNow model has maintained a solid Q2 growth estimate of 2.30% SAAR, reflecting steady, if cautious, optimism. However, the market remains wary, with recent data suggesting that the US economy may face significant headwinds if trade tensions escalate.
In Japan, recent data surprised to the upside, with Overall Household Spending for March rising 2.10% y/y, well above the 0.20% forecast and sharply reversing the prior month’s -0.50% decline. This improvement in consumer spending is a positive sign for the Japanese economy, potentially reducing the pressure on the Bank of Japan (BoJ) to intervene in the yen market.
Technical Analysis
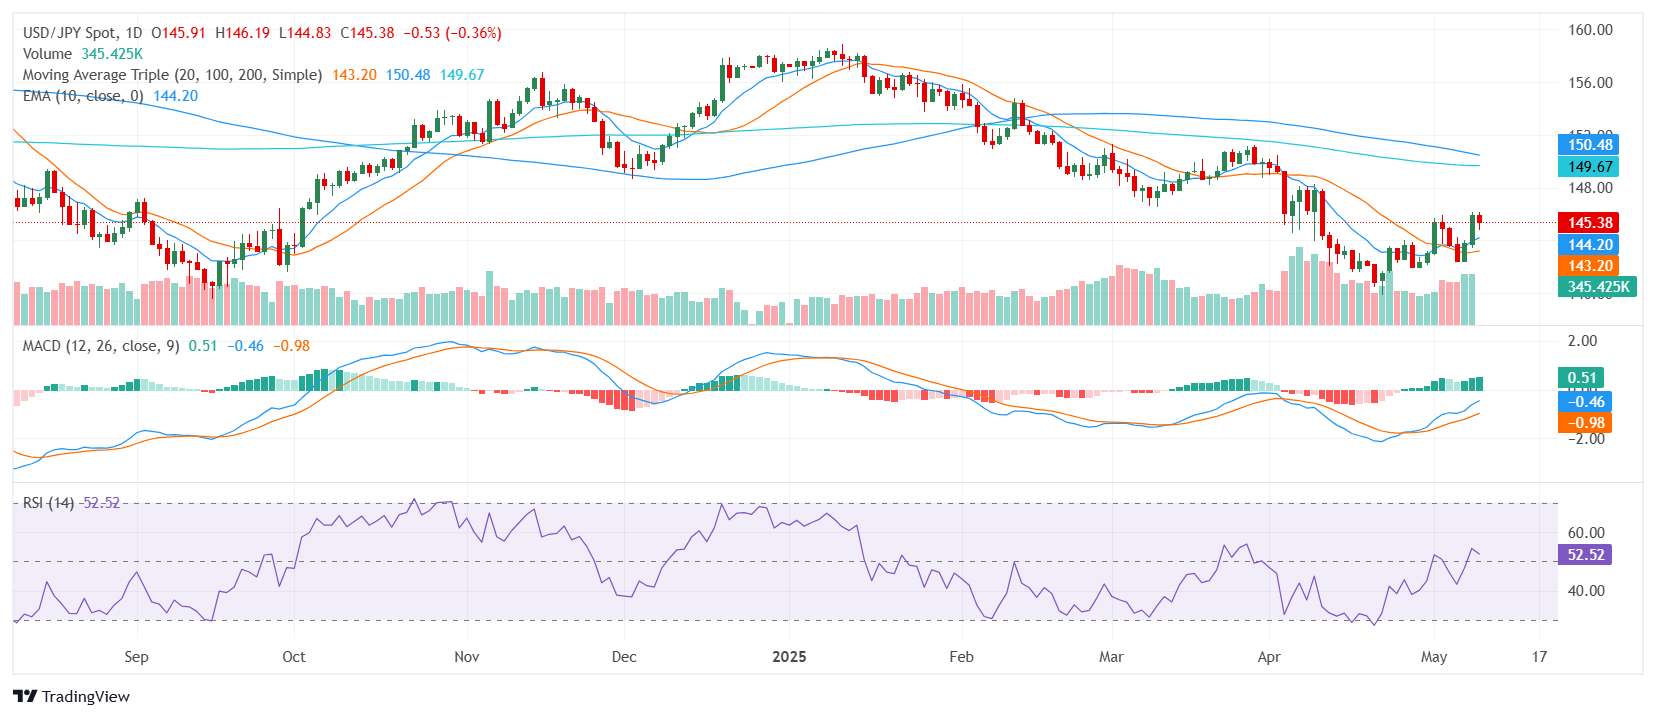
USD/JPY is currently trading near 145.00, with a bearish bias reinforced by several key technical signals. The 50-day EMA at 146.16 and 50-day SMA at 146.31 both indicate downward pressure, as do the 100-day SMA at 150.46 and 200-day SMA at 149.57, which remain firmly in sell territory. The 20-day SMA at 143.17 provides some support, but momentum indicators are mixed, with the RSI at 52.54 (neutral) and MACD flashing a buy signal.
Key support levels for the pair are identified at 144.82, 144.79, and 144.49, while resistance sits at 146.16, 146.31, and 148.30. A break below the 144.80 level could trigger further downside, while a recovery above 146.30 would be needed to confirm a bullish reversal.
Daily Chart
Author

Patricio Martín
FXStreet
Patricio is an economist from Argentina passionate about global finance and understanding the daily movements of the markets.