USD/JPY sees volatility as markets asses US Core PCE and BOJ's Decision
- The pair stands rose nearly to 150.00 after four consecutive days of losses.
- USD/JPY surrendered earlier gains after the BOJ's Monetary Policy Statement reaffirmed its ultra-loose policy.
- Core PCE from the US retreated to 4.1% YoY in June, fueling a decrease in US yields.

At the time of writing, the USD/JPY pair is trading near the 150.00 area, 1% above its opening price, after reaching a daily low of 138.05. The U.S. dollar, measured by the DXY index, trades relatively flat at the end of the week following pressured down by soft Core Personal Consumption Expenditures (PCE) figures from June.
In that sense, US Treasury yields are decreasing to Core PCE, retreating to 4.1% below the expectations as Fed Chair Jerome Powell clearly stated that ongoing decisions will depend on incoming data. However, the Federal Reserve (Fed), until the next September meeting, will get two additional sets of inflation and job report figures which will be the ones which model the tightening expectations.
However, the pair’s upwards trajectory is explained by markets considering dovish the Bank of Japan (BoJ) monetary policy decision. No hikes were announced or hinted but concluded with an unexpected Yield Curve Control (YCC) adjustment. Regarding Governor Ueda's comments, he stated that the decision was not a step toward normalisation as the bank is still far from where it can raise short-term rates, and its dovish tone seems to be weakening the Yen.
USD/JPY Levels to watch
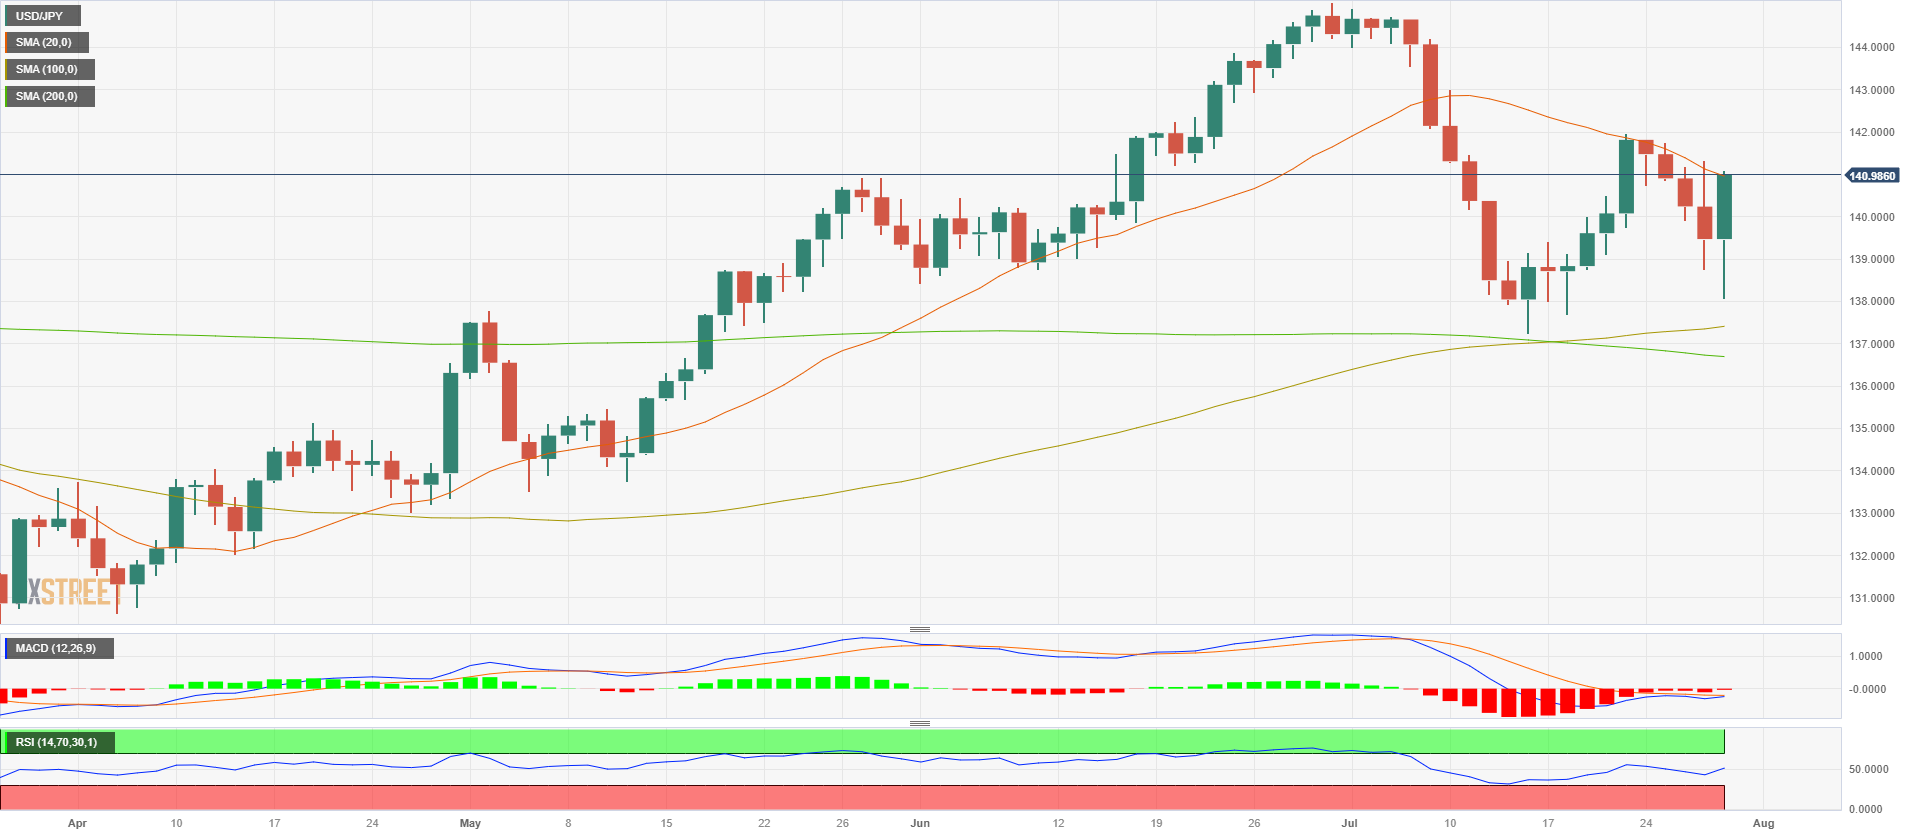
The technical outlook for the USD/JPY is neutral to bullish for the short term. Indicators have gained some strength but remain in negative territory while the pair is capped by the 20-day Simple Moving Average (SMA) at 140.93.
Resistance Levels: 140.93 (20-day SMA), 141.50, 142.00.
Support levels: 138.70, 138.00, 137.40 (100-day SMA).
USD/JPY Daily chart
USD/JPY
Overview
Today last price140.97
Today Daily Change1.50
Today Daily Change %1.08
Today daily open139.47
Trends
Daily SMA20141.13
Daily SMA50140.9
Daily SMA100137.35
Daily SMA200136.73
Levels
Previous Daily High141.32
Previous Daily Low138.76
Previous Weekly High141.96
Previous Weekly Low137.68
Previous Monthly High145.07
Previous Monthly Low138.43
Daily Fibonacci 38.2%139.74
Daily Fibonacci 61.8%140.35
Daily Pivot Point S1138.38
Daily Pivot Point S2137.29
Daily Pivot Point S3135.82
Daily Pivot Point R1140.94
Daily Pivot Point R2142.41
Daily Pivot Point R3143.5
Author

Patricio Martín
FXStreet
Patricio is an economist from Argentina passionate about global finance and understanding the daily movements of the markets.