USD/JPY Price Forecast: US Dollar Weakness raises risk of a bearish bias below 144.00
- USD/JPY faces pressure as bullish momentum fades.
- The USD/JPY momentum indicators signal fading trend strength, as the ADX and MACD weaken.
- Broader US Dollar weakness adds to downside pressure on USD/JPY, pushing prices toward 144.00.

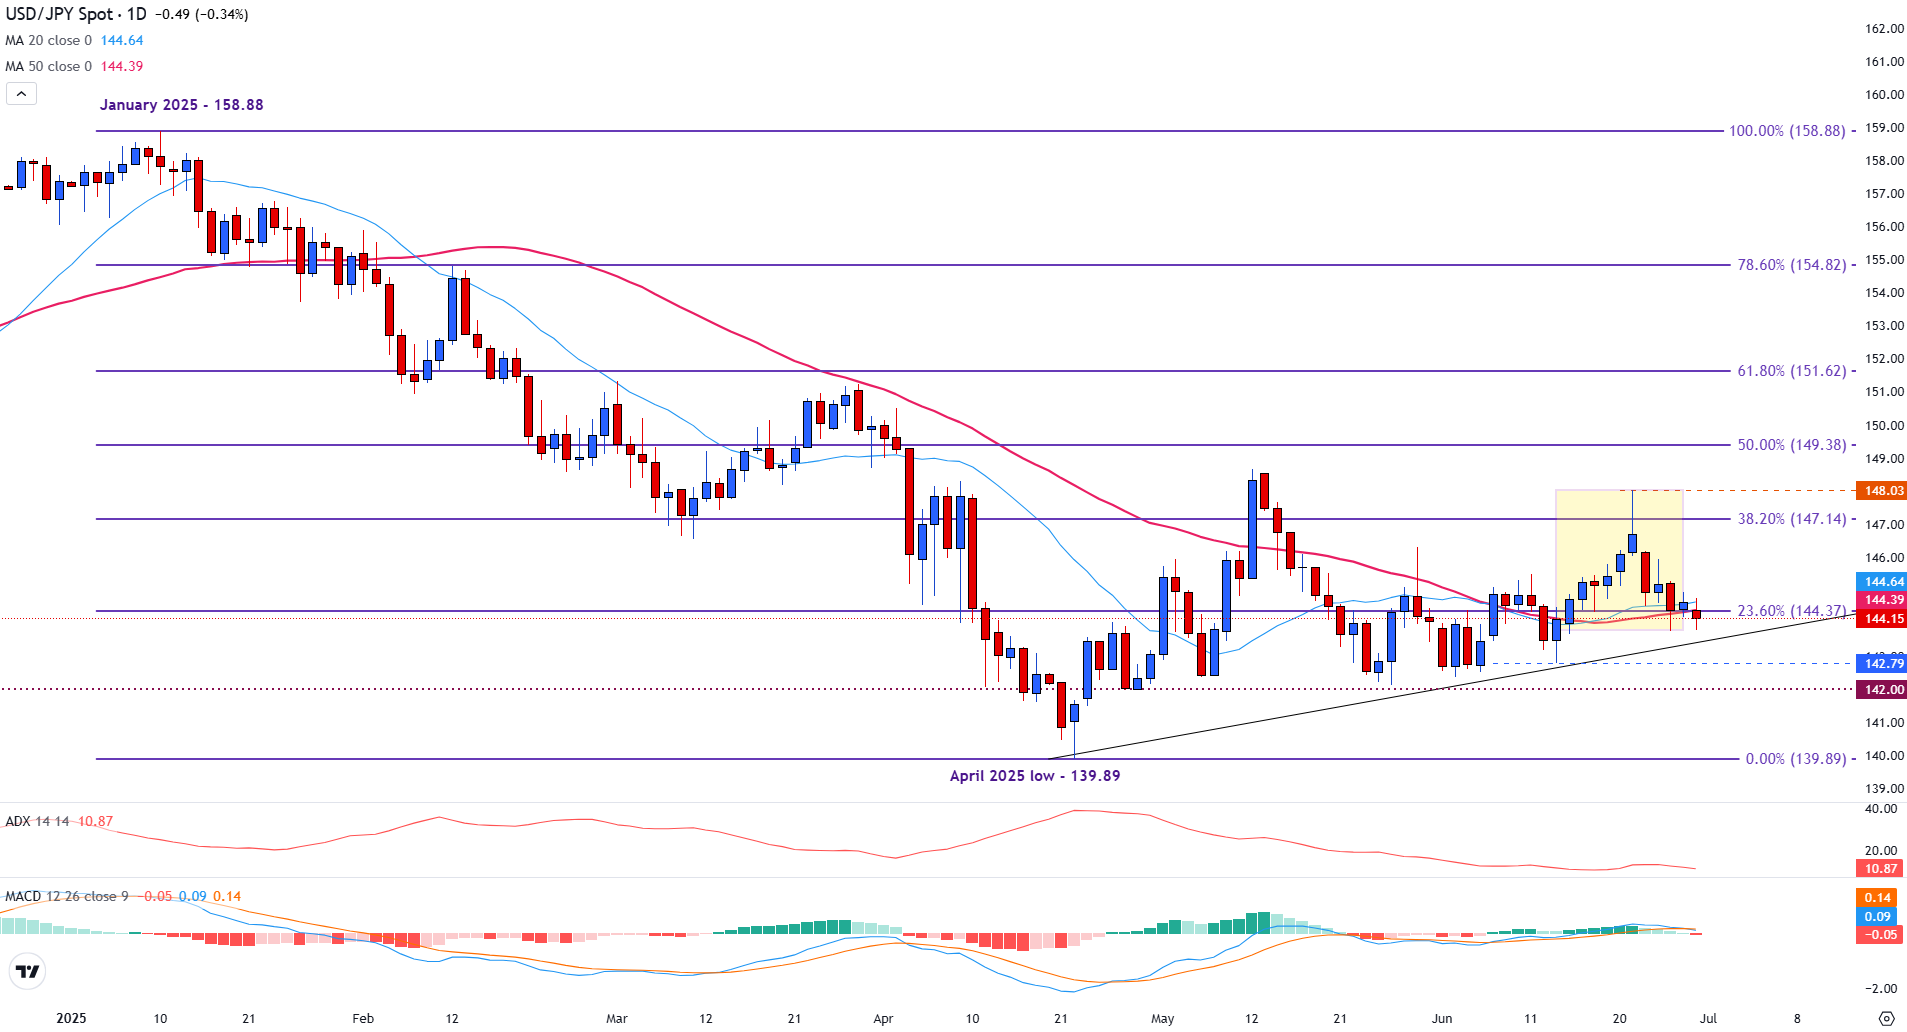
The USD/JPY is struggling to hold key support on Monday as bullish momentum continues to fade, with both the daily and weekly charts indicating weakening trend strength.
After failing to sustain gains above the 148.00 level last week, the pair has drifted lower, moving back toward rising trendline support near the 144.00 handle.
This trendline currently aligns with the 23.6% Fibonacci retracement of the January–April decline at 144.37, a zone the pair is now trying to defend. Monday’s price action shows USD/JPY attempting to stabilize above this support area, but momentum indicators suggest the move may lack conviction.
At the time of writing, the pair is trading around 144.19. With momentum softening across various timeframes, technical signals continue to indicate a range-bound market, increasing the risk of a downside break if support levels fail to hold.
Momentum indicators hint at fading trend strength for USD/JPY
The Average Directional Index (ADX) on the daily timeframe has dropped to 10.87, indicating an extremely weak trend, even more so than the weekly reading. This further confirms that recent moves are corrective in nature rather than part of a sustained trend.
The Moving Average Convergence Divergence (MACD) on the daily chart is also flattening out, with histogram bars losing strength and the signal line turning sideways. This suggests a lack of bullish follow-through after last week’s failed breakout near 148.00.
USD/JPY daily chart
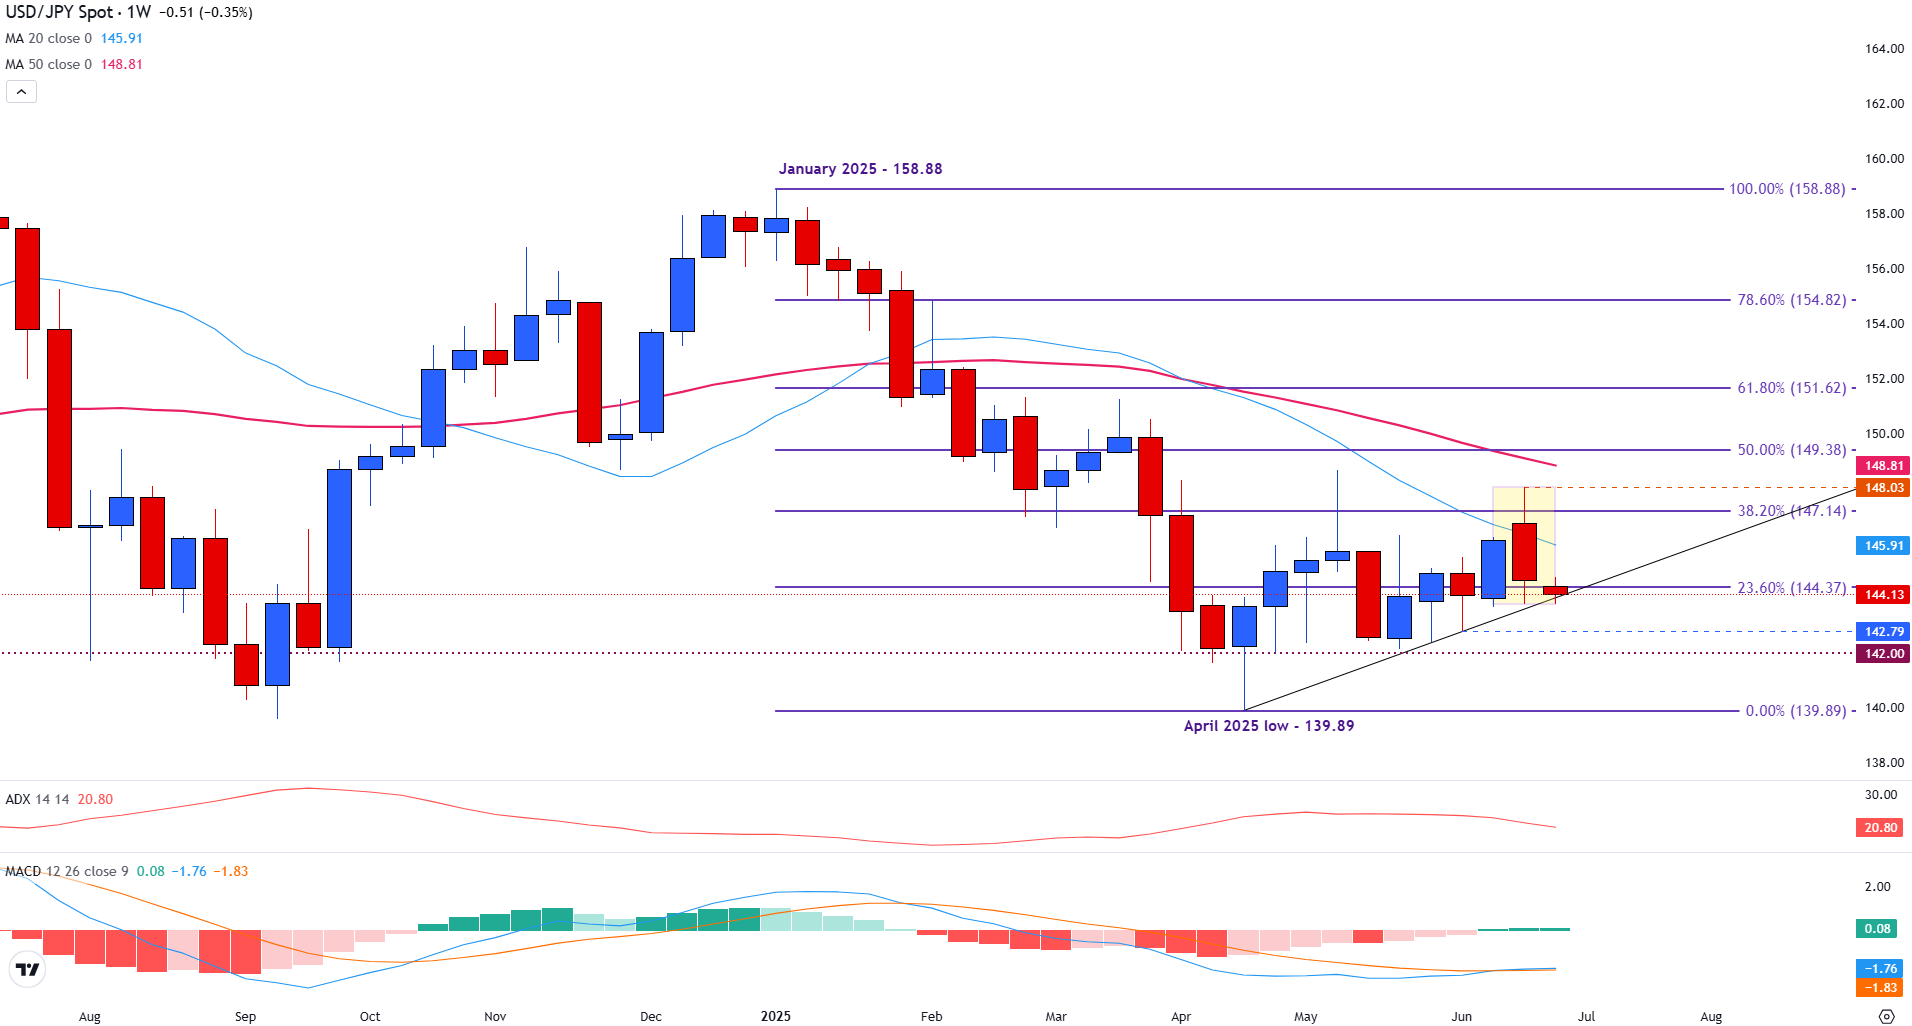
The weekly chart below illustrates how longer-term moving averages continue to act as dynamic support and resistance for USD/JPY price action.
Last week, the pair surged after climbing above both the 20-week Simple Moving Average (SMA) and the 38.2% Fibonacci retracement at 147.14.
A weaker Yen helped fuel the recovery, briefly lifting the pair to retest the psychological 148.00 level.
USD/JPY dips below the 20-week SMA as bullish momentum fades
However, the move stalled as profit-taking and a lack of bullish follow-through triggered a reversal. This is reflected in the weekly candle’s thin upper wick, indicating fading buying interest near 148.00. The pair has since slipped back below the 20-week SMA, which now turns into resistance at 145.92.
Momentum signals are softening. The ADX closed last week pointing lower, indicating weakening trend strength. Meanwhile, the MACD remains below the zero line, suggesting any upside seen so far is likely corrective rather than the start of a sustainable uptrend.
USD/JPY weekly chart
Bearish bias persists for USD/JPY below 144.00
Looking to this week, Monday’s price action has pushed the pair toward rising trendline support, which is currently holding above the psychological 144.00 level.
A break below 144.00 could bring the 142.79 area into focus, the third touchpoint of the ascending trendline. Below that, 142.00 stands as another key psychological level, with a deeper move possibly exposing the 140.00 handle.
The April trendline remains a key short-term support structure; however, broader technical indicators suggest a cautious outlook. Both the 20 and 50-week SMAs continue to slope downward, reinforcing the longer-term bearish bias unless price can reclaim and hold above the 149.00 region.
Japanese Yen FAQs
The Japanese Yen (JPY) is one of the world’s most traded currencies. Its value is broadly determined by the performance of the Japanese economy, but more specifically by the Bank of Japan’s policy, the differential between Japanese and US bond yields, or risk sentiment among traders, among other factors.
One of the Bank of Japan’s mandates is currency control, so its moves are key for the Yen. The BoJ has directly intervened in currency markets sometimes, generally to lower the value of the Yen, although it refrains from doing it often due to political concerns of its main trading partners. The BoJ ultra-loose monetary policy between 2013 and 2024 caused the Yen to depreciate against its main currency peers due to an increasing policy divergence between the Bank of Japan and other main central banks. More recently, the gradually unwinding of this ultra-loose policy has given some support to the Yen.
Over the last decade, the BoJ’s stance of sticking to ultra-loose monetary policy has led to a widening policy divergence with other central banks, particularly with the US Federal Reserve. This supported a widening of the differential between the 10-year US and Japanese bonds, which favored the US Dollar against the Japanese Yen. The BoJ decision in 2024 to gradually abandon the ultra-loose policy, coupled with interest-rate cuts in other major central banks, is narrowing this differential.
The Japanese Yen is often seen as a safe-haven investment. This means that in times of market stress, investors are more likely to put their money in the Japanese currency due to its supposed reliability and stability. Turbulent times are likely to strengthen the Yen’s value against other currencies seen as more risky to invest in.
Author

Tammy Da Costa, CFTe®
FXStreet
Tammy is an economist and market analyst with a deep passion for financial markets, particularly commodities and geopolitics.