USD/JPY Price Forecast: Tumbles below 156.00 as US economy slows down
- USD/JPY falls 0.54% as soft US data boosts confidence in a December Fed rate cut.
- Pair tests key support, though broader uptrend remains intact with higher highs and higher lows.
- Break below support risks moves toward 155.00–154.00, while reclaiming 156.00 opens path to higher resistance.

USD/JPY makes a U-turn and tumbles over 0.54% on Tuesday as investors grew confident that the Federal Reserve will cut rates at the December meeting, following a soft US inflation report, along with weaker than expected Retail Sales. At the time of writing the pair trades at 155.98, below the 156.00 figure for the first time in four days.
USD/JPY Price Forecast: Technical outlook
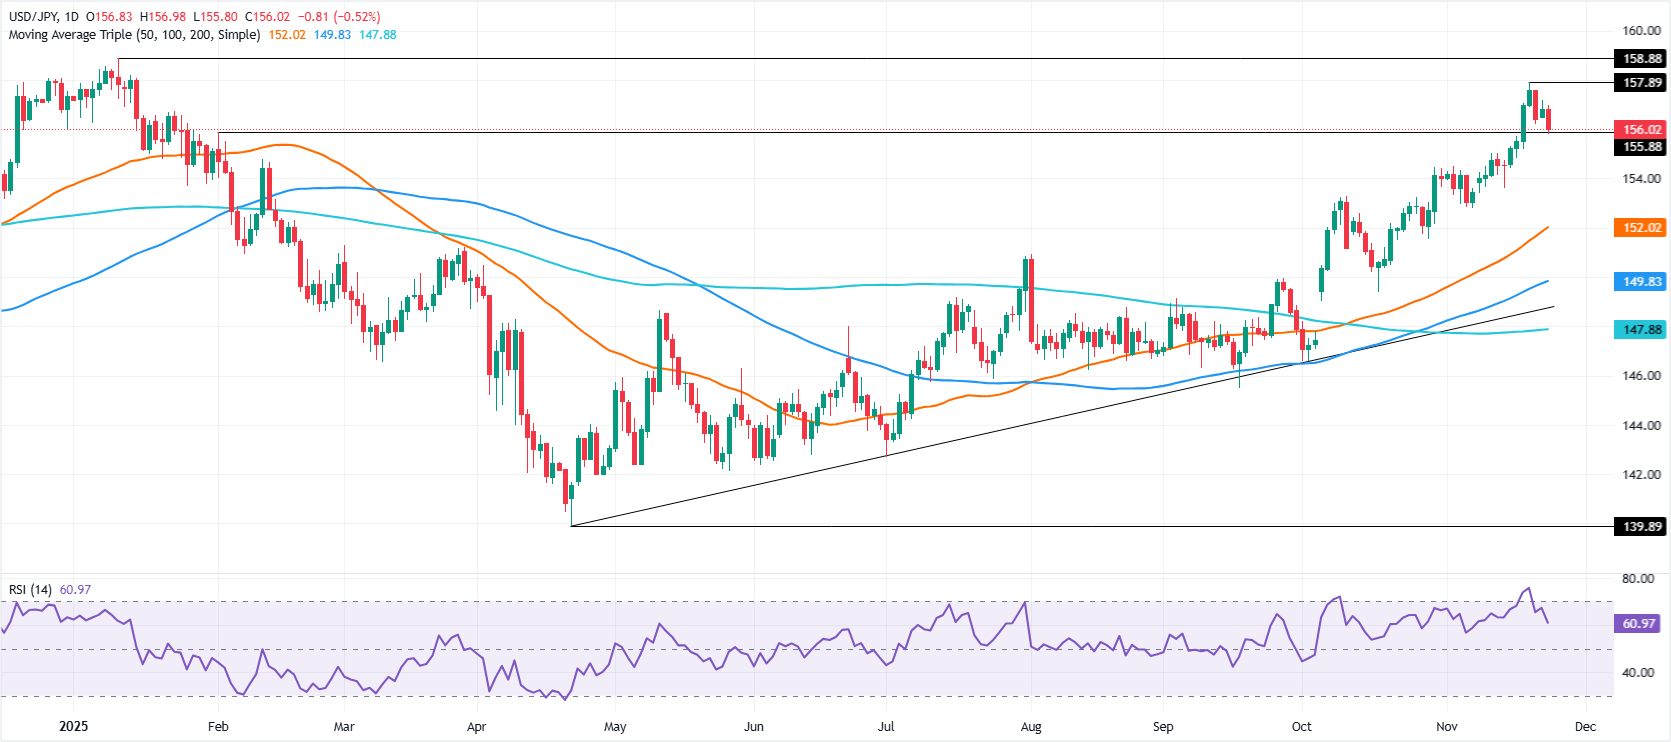
The USD/JPY is upwardly biased, but as of writing is texting previous resistance turned support, the February 10 high at 155.88. Nevertheless, the pair continues to print successive series of higher highs, higher lows an indication that bulls are in charge. Additionally, the Relative Strength Index (RSI) although edging lower it remains at positive territory.
In the short-term, if USDJPY tumbles below 155.50, this clears the path to test the 155.00 mark, followed by the 154.00 figure and the November 14 daily low of 153.62. If surpassed, the next stop would be the 50-day SMA at 152.02.
On the flip side, if USD/JPY clears 156.00, the next resistance will be the November’s high at 157.89, ahead of the yeatly peak of 158.88.
USD/JPY Price Chart – Daily
Japanese Yen Price This week
The table below shows the percentage change of Japanese Yen (JPY) against listed major currencies this week. Japanese Yen was the strongest against the US Dollar.
| USD | EUR | GBP | JPY | CAD | AUD | NZD | CHF | |
|---|---|---|---|---|---|---|---|---|
| USD | -0.46% | -0.53% | -0.36% | -0.02% | -0.13% | -0.16% | -0.15% | |
| EUR | 0.46% | -0.07% | 0.11% | 0.44% | 0.32% | 0.36% | 0.32% | |
| GBP | 0.53% | 0.07% | 0.16% | 0.52% | 0.39% | 0.42% | 0.39% | |
| JPY | 0.36% | -0.11% | -0.16% | 0.34% | 0.15% | 0.07% | 0.19% | |
| CAD | 0.02% | -0.44% | -0.52% | -0.34% | -0.12% | -0.12% | -0.13% | |
| AUD | 0.13% | -0.32% | -0.39% | -0.15% | 0.12% | 0.00% | 0.02% | |
| NZD | 0.16% | -0.36% | -0.42% | -0.07% | 0.12% | -0.01% | -0.00% | |
| CHF | 0.15% | -0.32% | -0.39% | -0.19% | 0.13% | -0.02% | 0.00% |
The heat map shows percentage changes of major currencies against each other. The base currency is picked from the left column, while the quote currency is picked from the top row. For example, if you pick the Japanese Yen from the left column and move along the horizontal line to the US Dollar, the percentage change displayed in the box will represent JPY (base)/USD (quote).
Author

Christian Borjon Valencia
FXStreet
Markets analyst, news editor, and trading instructor with over 14 years of experience across FX, commodities, US equity indices, and global macro markets.

















