USD/JPY Price Forecast: Strives to break above 200-day EMA
- USD/JPY advances as the Japanese Yen underperforms across the board.
- Economists expect Tokyo CPI ex. Fresh Food to have risen at a moderate pace of 2.5% on year in August.
- The US Dollar trades calmly as Fed’s Cook decides to file a lawsuit to keep her job.

The USD/JPY pair trades 0.4% higher to near 148.00 during the late Asian trading session on Wednesday. The pair advances as the Japanese Yen (JPY) underperforms its peers amid uncertainty surrounding the Tokyo Consumer Price Index (CPI) data for August, which is scheduled to be released on Friday.
Japanese Yen Price Today
The table below shows the percentage change of Japanese Yen (JPY) against listed major currencies today. Japanese Yen was the weakest against the US Dollar.
| USD | EUR | GBP | JPY | CAD | AUD | NZD | CHF | |
|---|---|---|---|---|---|---|---|---|
| USD | 0.22% | 0.21% | 0.37% | 0.04% | 0.11% | 0.25% | 0.12% | |
| EUR | -0.22% | -0.01% | 0.09% | -0.23% | -0.18% | -0.01% | -0.14% | |
| GBP | -0.21% | 0.00% | 0.14% | -0.17% | -0.06% | 0.04% | -0.09% | |
| JPY | -0.37% | -0.09% | -0.14% | -0.28% | -0.27% | -0.12% | -0.18% | |
| CAD | -0.04% | 0.23% | 0.17% | 0.28% | 0.07% | 0.23% | 0.09% | |
| AUD | -0.11% | 0.18% | 0.06% | 0.27% | -0.07% | 0.17% | 0.03% | |
| NZD | -0.25% | 0.00% | -0.04% | 0.12% | -0.23% | -0.17% | -0.13% | |
| CHF | -0.12% | 0.14% | 0.09% | 0.18% | -0.09% | -0.03% | 0.13% |
The heat map shows percentage changes of major currencies against each other. The base currency is picked from the left column, while the quote currency is picked from the top row. For example, if you pick the Japanese Yen from the left column and move along the horizontal line to the US Dollar, the percentage change displayed in the box will represent JPY (base)/USD (quote).
Investors will closely monitor the Tokyo CPI data as it will influence market expectations for the Bank of Japan’s (BoJ) monetary policy outlook. Tokyo CPI ex. Fresh Food is expected to have grown at an annual pace of 2.5%, slower than the prior reading of 2.9%. Signs of cooling price pressures would force traders to trim bets supporting interest rate hikes by the BoJ in the remainder of the year.
Meanwhile, the US Dollar (USD) trades calmly as Federal Reserve (Fed) Governor Lisa Cook has confirmed to file a lawsuit against her termination by United States (US) President Donald Trump over mortgage allegations.
Financial market participants have seen the event as a serious attack on the Fed’s independence and Trump’s intention to politicize the central bank to fulfil his economic agenda. "The concern is the intent of the Trump administration: it’s not to preserve Fed integrity, it’s to install Trump’s own people at the Fed,” analysts at Capital.com said, Reuters reported.
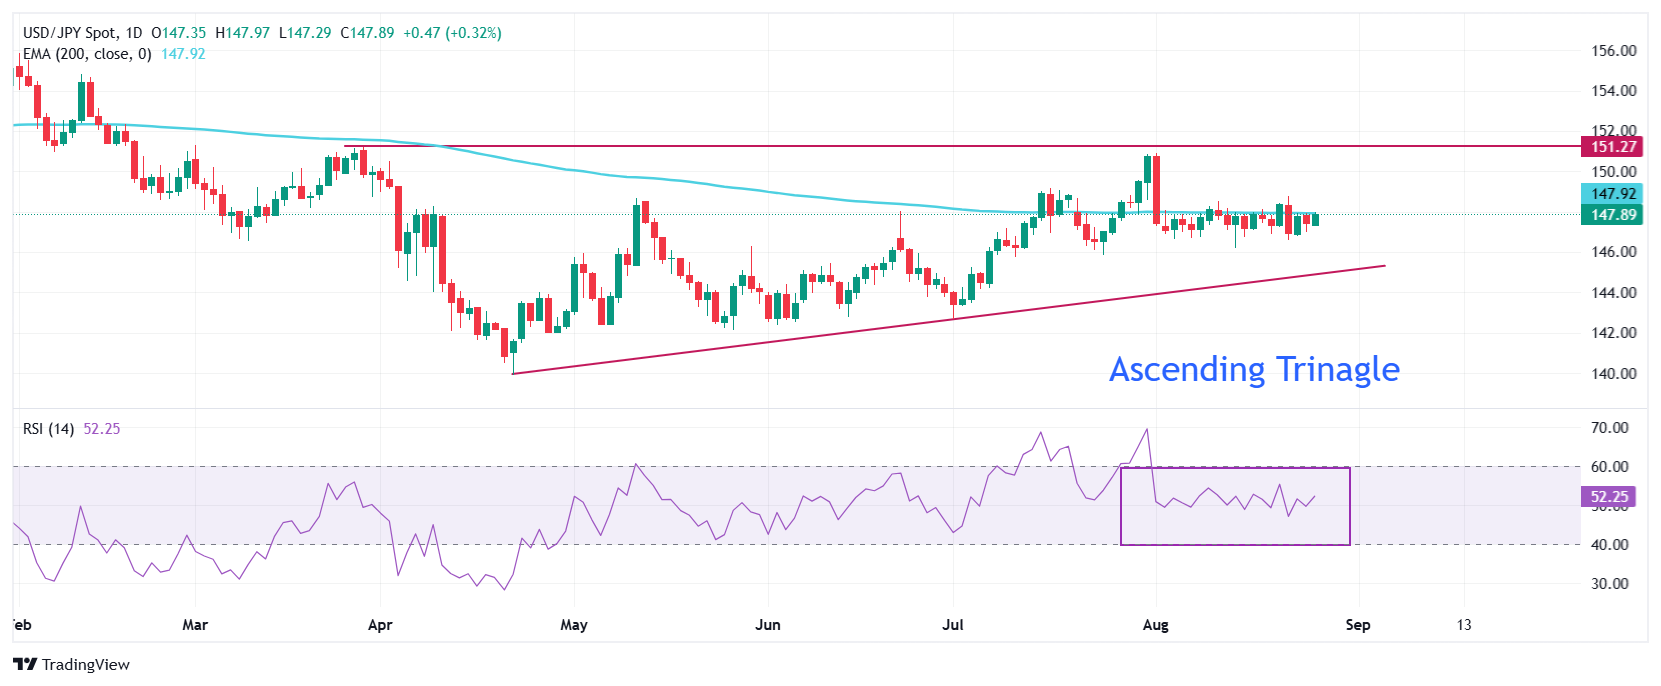
USD/JPY trades in an Ascending Triangle formation, which indicates a sharp volatility contraction. The upward-sloping border of the above-mentioned chart pattern is plotted from the April 22 low of 139.40, while the horizontal resistance is plotted from the March 28 high of 151.20.
The asset strives to break above the 200-day Exponential Moving Average (EMA), which trades around 147.90.
The 14-day Relative Strength Index (RSI) oscillates inside the 40.00-60.00 range, indicating a sideways trend.
The pair would see more upside to near the psychological level of 150.00 and the March 28 high of 151.20 if it breaks above the August 22 high of 148.78.
On the flip side, a reversal move by the pair below the July 24 low of 145.85 would pave the way for the July 7 low at 144.22, followed by the July 3 low of 143.45.
USD/JPY daily chart
US Dollar FAQs
The US Dollar (USD) is the official currency of the United States of America, and the ‘de facto’ currency of a significant number of other countries where it is found in circulation alongside local notes. It is the most heavily traded currency in the world, accounting for over 88% of all global foreign exchange turnover, or an average of $6.6 trillion in transactions per day, according to data from 2022. Following the second world war, the USD took over from the British Pound as the world’s reserve currency. For most of its history, the US Dollar was backed by Gold, until the Bretton Woods Agreement in 1971 when the Gold Standard went away.
The most important single factor impacting on the value of the US Dollar is monetary policy, which is shaped by the Federal Reserve (Fed). The Fed has two mandates: to achieve price stability (control inflation) and foster full employment. Its primary tool to achieve these two goals is by adjusting interest rates. When prices are rising too quickly and inflation is above the Fed’s 2% target, the Fed will raise rates, which helps the USD value. When inflation falls below 2% or the Unemployment Rate is too high, the Fed may lower interest rates, which weighs on the Greenback.
In extreme situations, the Federal Reserve can also print more Dollars and enact quantitative easing (QE). QE is the process by which the Fed substantially increases the flow of credit in a stuck financial system. It is a non-standard policy measure used when credit has dried up because banks will not lend to each other (out of the fear of counterparty default). It is a last resort when simply lowering interest rates is unlikely to achieve the necessary result. It was the Fed’s weapon of choice to combat the credit crunch that occurred during the Great Financial Crisis in 2008. It involves the Fed printing more Dollars and using them to buy US government bonds predominantly from financial institutions. QE usually leads to a weaker US Dollar.
Quantitative tightening (QT) is the reverse process whereby the Federal Reserve stops buying bonds from financial institutions and does not reinvest the principal from the bonds it holds maturing in new purchases. It is usually positive for the US Dollar.
Author

Sagar Dua
FXStreet
Sagar Dua is associated with the financial markets from his college days. Along with pursuing post-graduation in Commerce in 2014, he started his markets training with chart analysis.


