USD/JPY Price Forecast: Rebounds towards 144.00 after three-day slide
- USD/JPY snaps losing streak, rises over 0.20% amid profit-taking before weekend.
- RSI hints at bottoming, but buyers must clear 144.00 for bullish follow-through.
- Downside risks remain if pair fails to hold above key 143.00 support.

The USD/JPY pair snapped three straight days of losses and climbed over 0.20% on Thursday late during the North American session. The Yen’s recent depreciation, despite falling US Treasury yields and amid the lack of a catalyst, could be attributed to traders booking profits ahead of the weekend. At the time of writing, the pair trades at 143.96 after bouncing off daily lows of 142.80.
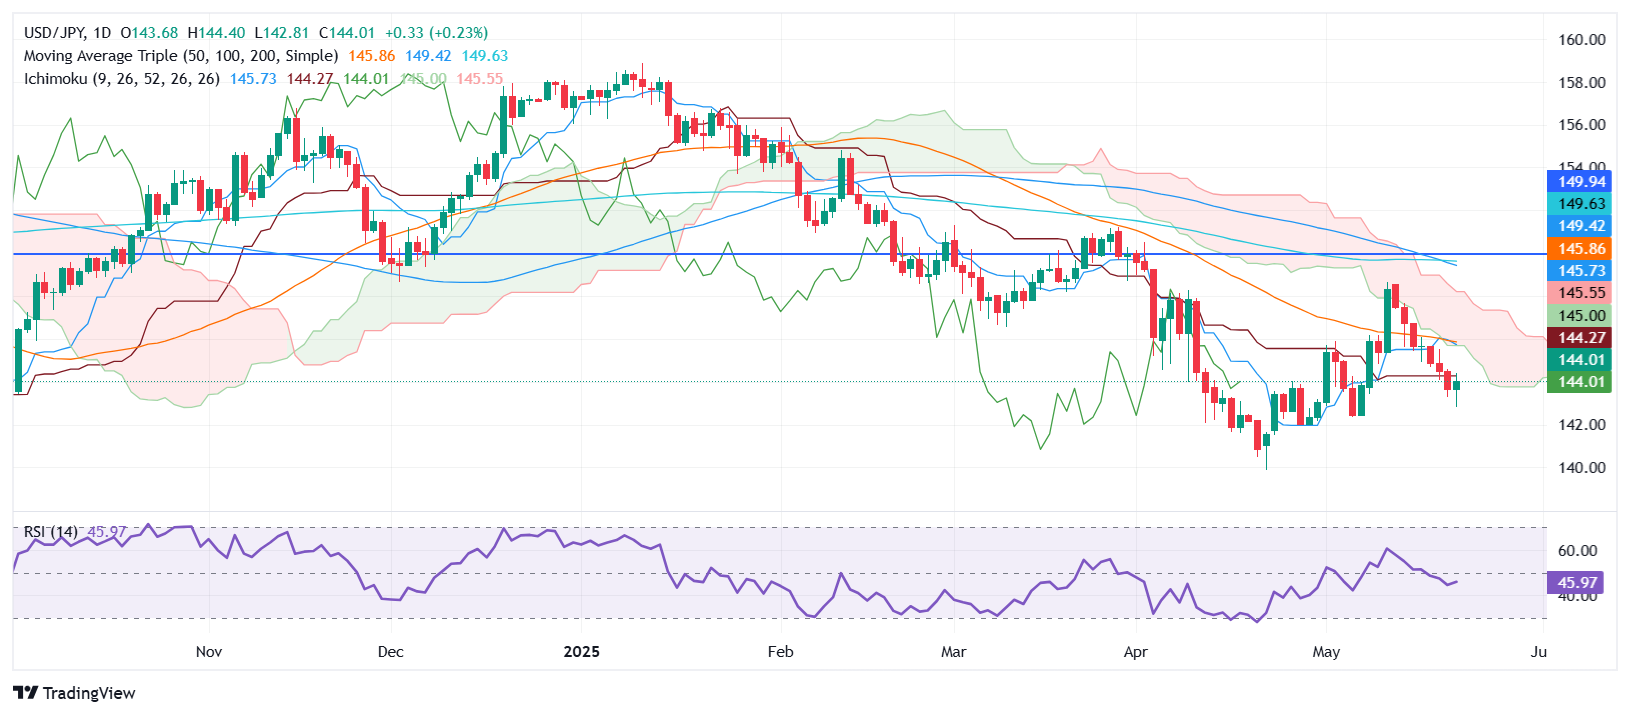
USD/JPY Price Forecast: Technical outlook
USD/JPY suggests buyers overcame sellers, pushing the pair above the 143.00 figure and poised to curtail the Greenback’s fall against the Yen. Momentum suggests the pair could be bottoming out, as depicted by the Relative Strength Index (RSI).
Nevertheless, the RSI remains bearish, though it edges towards its 50-neutral line.
That said, buyers will need USD/JPY to clear 144.00. A breach of the latter will expose key resistance levels, led by the Kijun-sen at 144.27 and the 20-day Simple Moving Average (SMA) at 144.65. If those levels are cleared, the Senkou Span A confluence and the psychological 145.00 figure will follow.
The USD/JPY must remain below the Kijun-sen for a bearish continuation. If achieved, the first support would be 143.00, followed by the May 21 swing low of 142.80. Once hurdled, the next stop would be the previous cycle low seen at 142.35, the May 6 daily low.
(This story was corrected on May 22 at 21:26 GMT to say in the headline and the first paragraph that USD/JPY slid for three consecutive days, not seven)
USD/JPY Price Chart – Daily
Japanese Yen PRICE This week
The table below shows the percentage change of Japanese Yen (JPY) against listed major currencies this week. Japanese Yen was the strongest against the US Dollar.
| USD | EUR | GBP | JPY | CAD | AUD | NZD | CHF | |
|---|---|---|---|---|---|---|---|---|
| USD | -0.86% | -0.99% | -0.86% | -0.84% | -0.15% | -0.30% | -0.91% | |
| EUR | 0.86% | -0.17% | 0.05% | 0.09% | 0.83% | 0.62% | -0.05% | |
| GBP | 0.99% | 0.17% | -0.10% | 0.23% | 1.00% | 0.78% | 0.09% | |
| JPY | 0.86% | -0.05% | 0.10% | 0.02% | 0.84% | 0.76% | -0.02% | |
| CAD | 0.84% | -0.09% | -0.23% | -0.02% | 0.79% | 0.55% | -0.14% | |
| AUD | 0.15% | -0.83% | -1.00% | -0.84% | -0.79% | -0.21% | -0.87% | |
| NZD | 0.30% | -0.62% | -0.78% | -0.76% | -0.55% | 0.21% | -0.69% | |
| CHF | 0.91% | 0.05% | -0.09% | 0.02% | 0.14% | 0.87% | 0.69% |
The heat map shows percentage changes of major currencies against each other. The base currency is picked from the left column, while the quote currency is picked from the top row. For example, if you pick the Japanese Yen from the left column and move along the horizontal line to the US Dollar, the percentage change displayed in the box will represent JPY (base)/USD (quote).
Author

Christian Borjon Valencia
FXStreet
Markets analyst, news editor, and trading instructor with over 14 years of experience across FX, commodities, US equity indices, and global macro markets.