USD/JPY Price Forecast: Rebounds from YTD lows, bulls target 148.00
- Tweezers bottom’ pattern formed at 146.54 signals potential short-term trend reversal.
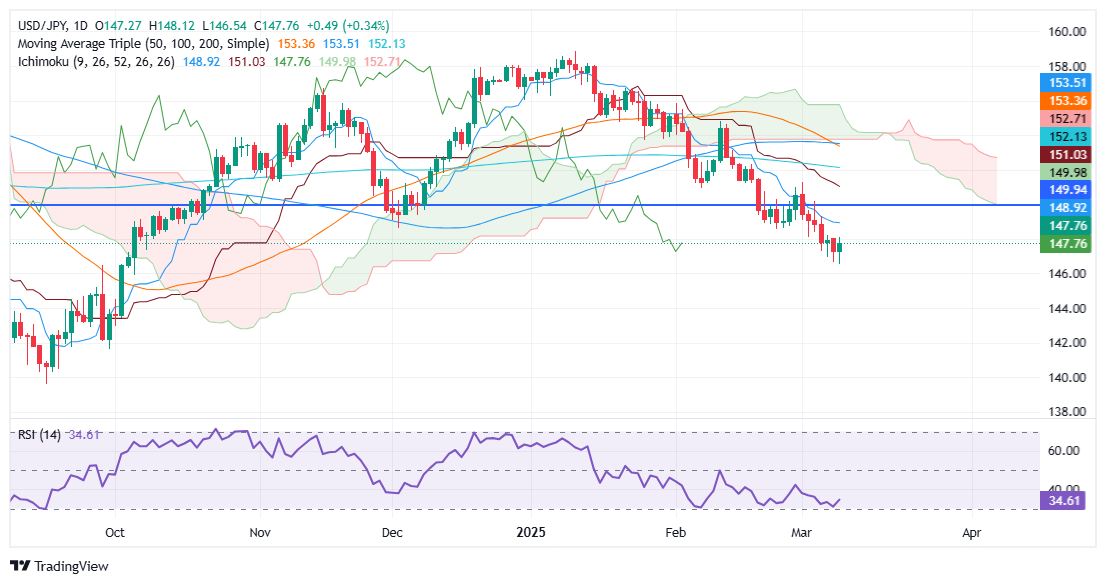
- RSI flattens, suggesting bearish momentum is losing steam.
- Key upside resistance seen at 148.00; clearance opens the door toward Senkou Span A at 149.79.

The USD/JPY rises as trade tensions loom due to back-and-forth tariff rhetoric between Canada and the United States (US), which initially weighed on the US Dollar. Nevertheless, as both countries agreed to lift tariffs, the pair advanced and traded at 147.77, up 0.34%.
USD/JPY Price Forecast: Technical outlook
USD/JPY formed a ‘tweezers bottom’ two candle chart pattern near the year-to-date (YTD) low of 146.54, hinting that the downtrend seems overextended after dropping from around 158.00 toward the current exchange rates. Despite being bearish, the Relative Strength Index (RSI) is flat, indicating that selling pressure is fading.
For a bearish continuation, USD/JPY needs to clear the YTD low of 146.54. If surpassed the next stop would be the September 30 swing low of 141.64, followed by the September 16 low of 139.58.
Conversely, if USD/JPY climbs above 148.00 a rally towards testing the Senkou Span A at 149.79 is on the cards.
USD/JPY Price Chart – Daily
Japanese Yen PRICE Today
The table below shows the percentage change of Japanese Yen (JPY) against listed major currencies today. Japanese Yen was the strongest against the Euro.
| USD | EUR | GBP | JPY | CAD | AUD | NZD | CHF | |
|---|---|---|---|---|---|---|---|---|
| USD | 0.02% | 0.01% | 0.00% | -0.05% | 0.03% | 0.00% | -0.02% | |
| EUR | -0.02% | -0.01% | -0.06% | -0.06% | 0.00% | -0.02% | -0.04% | |
| GBP | -0.01% | 0.01% | -0.02% | -0.05% | 0.02% | -0.01% | -0.02% | |
| JPY | 0.00% | 0.06% | 0.02% | -0.03% | 0.05% | 0.00% | 0.01% | |
| CAD | 0.05% | 0.06% | 0.05% | 0.03% | 0.08% | 0.04% | 0.03% | |
| AUD | -0.03% | -0.01% | -0.02% | -0.05% | -0.08% | -0.03% | -0.04% | |
| NZD | 0.00% | 0.02% | 0.00% | -0.01% | -0.04% | 0.03% | -0.01% | |
| CHF | 0.02% | 0.04% | 0.02% | -0.01% | -0.03% | 0.04% | 0.00% |
The heat map shows percentage changes of major currencies against each other. The base currency is picked from the left column, while the quote currency is picked from the top row. For example, if you pick the Japanese Yen from the left column and move along the horizontal line to the US Dollar, the percentage change displayed in the box will represent JPY (base)/USD (quote).
Author

Christian Borjon Valencia
FXStreet
Markets analyst, news editor, and trading instructor with over 14 years of experience across FX, commodities, US equity indices, and global macro markets.


