USD/JPY Price Forecast: Flat as traders eye Japan’s CPI
- USD/JPY hovers near 150.00 with 'gravestone doji' hinting at a possible downside.
- Slight bullish RSI; a break above 149.00 could target 149.47 and 150.00.
- If 149.00 isn't breached, sellers might drive the pair down to 148.34 (Tenkan-sen) and 148.00 support.

USD/JPY remains flatlined late in the North American session after traders digested monetary policy decisions by the Bank of Japan (BoJ) and the Federal Reserve (Fed). As both central banks maintained the “status quo,” traders turned the page and focused on the release of Japanese inflation figures at around 23:30 GMT. The pair is trading at 148.76, virtually unchanged.
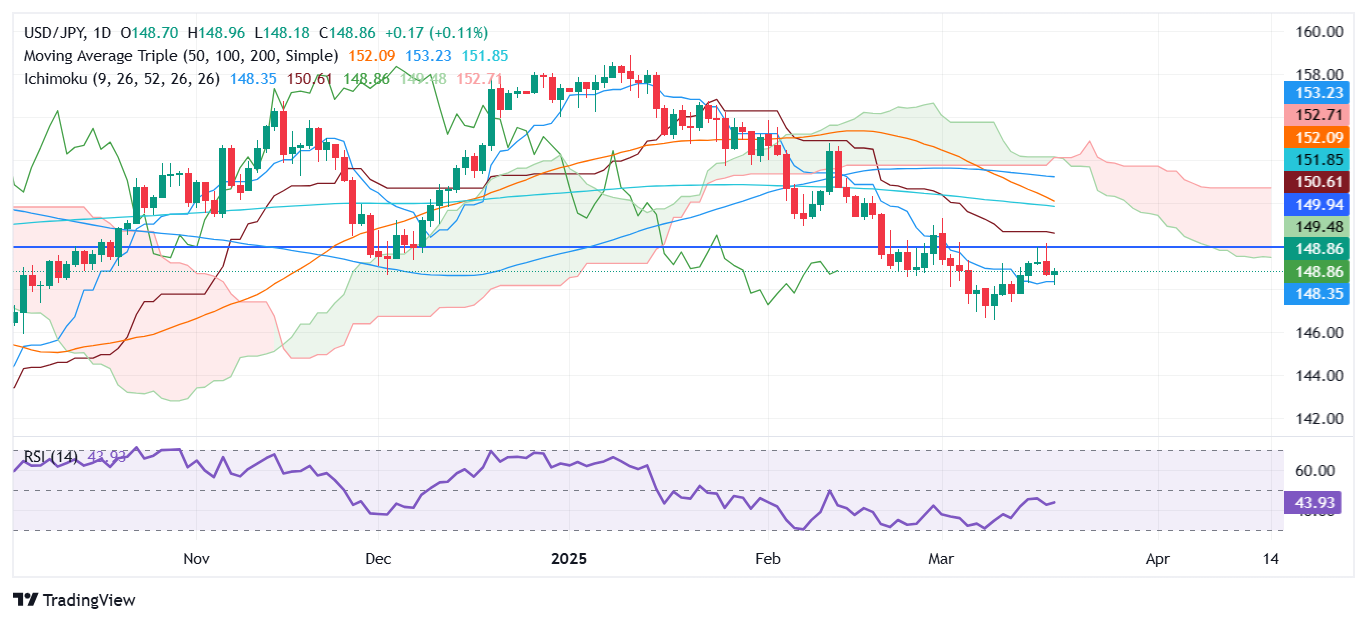
USD/JPY Price Forecast: Technical outlook
During the week, the USD/JPY pair has enjoyed a bounce though it failed to reclaim the 150.00 figure, which opened the door for some sideways trading. However, the formation of a ‘gravestone doji,’ alongside a bearish candle, suggested lower prices; buyers stepped in near 148.10 and drove the exchange rate higher.
The Relative Strength Index (RSI) is bearish, but as of this writing, the slope is edged up, indicating that momentum favors buyers.
If USD/JPY climbs past 149.00, the next resistance would be the Senkou Span A at 149.47, followed by the 150.00 figure. On further strength, the pair could aim for fresh highs near the Kijun-sen at 150.60.
Conversely, failure to claim 149.00 could lead to sellers challenging the Tenkan-sen at 148.34. A daily close below the latter opens the path for further downside, with key support levels being the 148.00 mark and the March 11 swing low of 146.54.
USD/JPY Price Chart – Daily
Japanese Yen PRICE This week
The table below shows the percentage change of Japanese Yen (JPY) against listed major currencies this week. Japanese Yen was the strongest against the Euro.
| USD | EUR | GBP | JPY | CAD | AUD | NZD | CHF | |
|---|---|---|---|---|---|---|---|---|
| USD | 0.23% | -0.22% | 0.03% | -0.37% | 0.44% | -0.18% | -0.33% | |
| EUR | -0.23% | -0.60% | -0.63% | -0.66% | 0.08% | -0.48% | -0.60% | |
| GBP | 0.22% | 0.60% | 0.29% | -0.26% | 0.66% | 0.09% | -0.07% | |
| JPY | -0.03% | 0.63% | -0.29% | -0.43% | 0.21% | -0.16% | -0.49% | |
| CAD | 0.37% | 0.66% | 0.26% | 0.43% | 0.66% | 0.20% | -0.45% | |
| AUD | -0.44% | -0.08% | -0.66% | -0.21% | -0.66% | -0.54% | -0.63% | |
| NZD | 0.18% | 0.48% | -0.09% | 0.16% | -0.20% | 0.54% | -0.12% | |
| CHF | 0.33% | 0.60% | 0.07% | 0.49% | 0.45% | 0.63% | 0.12% |
The heat map shows percentage changes of major currencies against each other. The base currency is picked from the left column, while the quote currency is picked from the top row. For example, if you pick the Japanese Yen from the left column and move along the horizontal line to the US Dollar, the percentage change displayed in the box will represent JPY (base)/USD (quote).
Author

Christian Borjon Valencia
FXStreet
Markets analyst, news editor, and trading instructor with over 14 years of experience across FX, commodities, US equity indices, and global macro markets.


