|

USD/JPY Price Forecast: Break below trendline lends chart a more bearish aspect

  • USD/JPY is rapidly selling off and is now probably in a downtrend on a short and medium-term basis. 
  • The pair will probably continue declining to targets in the lower 150s. 
  • RSI is oversold, raising the risk of a correction or consolidation forming. 

USD/JPY is declining steeply from its early July highs. After peaking at 161.95 on July 3 it has fallen over five Japanese Yen to the 156.50s on July 17. 

The break below the major trendline at 158.45 on July 13 was a gamechanger for the pair and taken together with the more recent break below the 157.15 July 15 low, has given the chart a much more bearish aspect. 

The short-term trend is bearish and the intermediate term trend is now also probably negative too. Given the old adage that “the trend is your friend” the odds favor a continuation lower over those timeframes. 

USD/JPY Daily Chart 

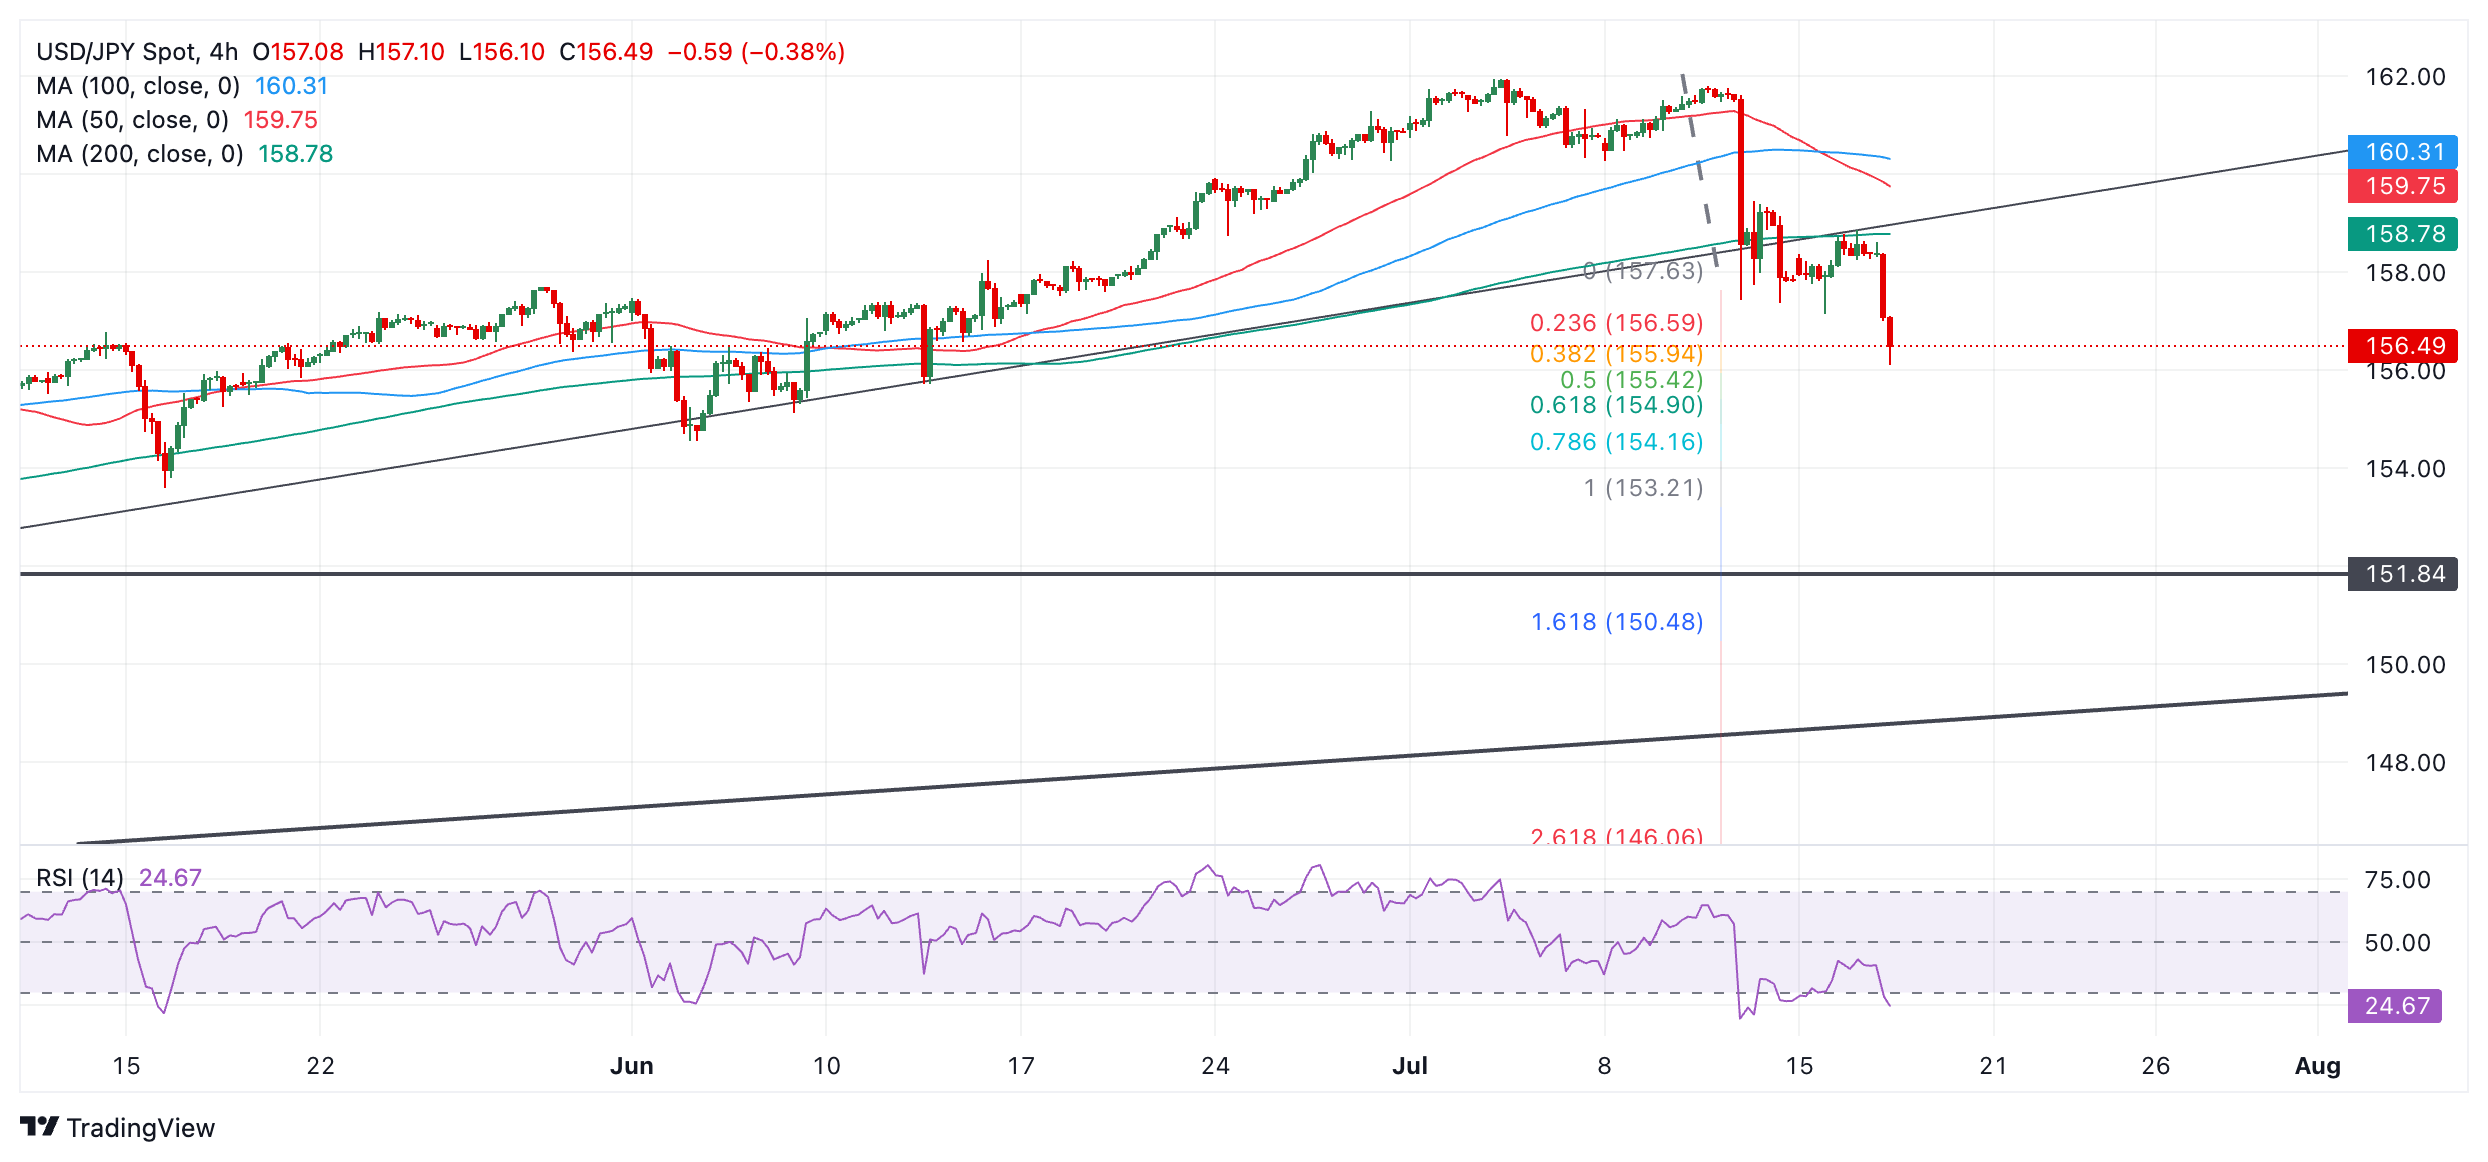
How much lower could USD/JPY go? The next immediate target is at 154.90, which is the 61.8% Fibonacci extension of the down move prior to the trendline break extrapolated lower. This is followed by 153.21, the 100% extrapolation of the same. 

A more bearish scenario could even envisage price falling to 151.84 and a key support level (October 2021 high). 

The Relative Strength Index (RSI) is in oversold territory indicating a rising chance of a pullback or consolidation delaying the pair’s descent.

Author

Joaquin Monfort

Joaquin Monfort is a financial writer and analyst with over 10 years experience writing about financial markets and alt data. He holds a degree in Anthropology from London University and a Diploma in Technical analysis.

More from Joaquin Monfort
Share:

Editor's Picks

EUR/USD loses ground below 1.1850 ahead of FOMC Minutes

The EUR/USD pair loses traction near 1.1840 during the early European session on Wednesday, pressured by renewed US Dollar demand. Traders brace for the Federal Open Market Committee Minutes for signals on future rate cuts, which will be released later on Wednesday. 

When is the UK CPI data and how could it affect GBP/USD?

The United Kingdom Consumer Price Index data for January is scheduled to be published today at 07:00 GMT. GBP/USD trades slightly lower at around 1.3556 as of writing. The 20-period Exponential Moving Average trends lower at 1.3593 and continues to cap rebounds. Price holds beneath this gauge, maintaining a short-term bearish bias.

Gold: Is the $5,000 level back in sight?

Gold snaps a two-day downtrend, as recovery gathers traction toward $5,000 on Wednesday. The US Dollar recovers from the overnight sell-off as rebalancing trades resume ahead of Fed Minutes. The 38.2% Fib support holds on the daily chart for now. What does that mean for Gold?

Pi Network rally defies market pressure ahead of its first anniversary

Pi Network is trading above $0.1900 at press time on Wednesday, extending the weekly gains by nearly 8% so far. The steady recovery is supported by a short-term pause in mainnet migration, which reduces pressure on the PI token supply for Centralized Exchanges. The technical outlook focuses on the $0.1919 resistance as bullish momentum increases.

UK jobs market weakens, bolstering rate cut hopes

In the UK, the latest jobs report made for difficult reading. Nonetheless, this represents yet another reminder for the Bank of England that they need to act swiftly given the collapse in inflation expected over the coming months. 

Top 3 Price Prediction: Bitcoin, Ethereum, and Ripple face downside risk as bears regain control

Bitcoin, Ethereum, and Ripple remain under pressure on Wednesday, with the broader trend still sideways. BTC is edging below $68,000, nearing the lower consolidating boundary, while ETH and XRP also declined slightly, approaching their key supports.