USD/JPY Price Analysis: Tests 14-month lows; next support at 140.00
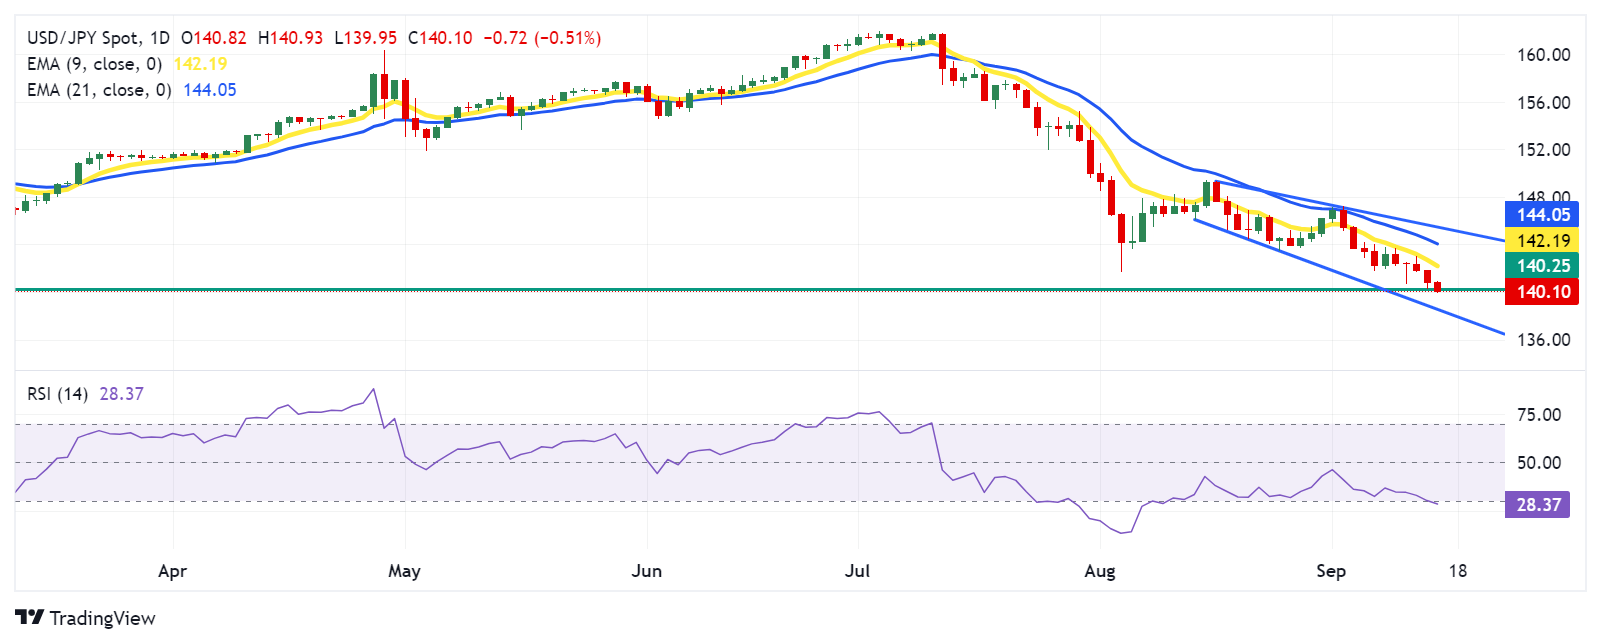
- USD/JPY extends its losing streak within a descending channel, suggesting a confirmed bearish bias.
- The 14-day RSI momentum indicator suggests an oversold situation and a potential for an upward correction soon.
- The pair tests the 14-month low at 140.25, followed by the lower boundary of the channel at the 138.50 level.

USD/JPY continues to decline for the fifth consecutive day, trading around 140.30 during the Asian session on Monday. An analysis of the daily chart showed the USD/JPY pair moves downward within a descending channel, indicating a confirmed bearish bias.
Additionally, the 9-day Exponential Moving Average (EMA) is lower than the 21-day EMA, indicating a downward momentum in the asset's price. However, the 14-day Relative Strength Index (RSI), a momentum indicator, is positioned below the 30 level, suggesting an oversold situation for the USD/JPY pair and a potential for an upward correction soon.
In terms of support, the USD/JPY pair is testing 140.25, which is the lowest level since July 2023, followed by the psychological level of 140.00. A successful breach below this level could reinforce the bearish bias and put pressure on the pair to test the lower boundary of the descending channel at the level of 138.50.
On the upside, the USD/JPY pair might first encounter a barrier at the 9-day EMA around 142.19, followed by the 21-day EMA at 144.04 level. A break above these EMAs might weaken the bearish sentiment and push the pair to test the upper boundary of the descending channel at the 145.50 level.
USD/JPY: Daily Chart
Japanese Yen PRICE Today
The table below shows the percentage change of Japanese Yen (JPY) against listed major currencies today. Japanese Yen was the strongest against the US Dollar.
| USD | EUR | GBP | JPY | CAD | AUD | NZD | CHF | |
|---|---|---|---|---|---|---|---|---|
| USD | -0.21% | -0.25% | -0.41% | -0.16% | -0.33% | -0.22% | -0.19% | |
| EUR | 0.21% | -0.10% | -0.23% | 0.01% | -0.18% | -0.07% | -0.03% | |
| GBP | 0.25% | 0.10% | -0.22% | 0.10% | -0.09% | 0.04% | 0.08% | |
| JPY | 0.41% | 0.23% | 0.22% | 0.25% | 0.13% | 0.20% | 0.15% | |
| CAD | 0.16% | -0.01% | -0.10% | -0.25% | -0.25% | -0.06% | -0.14% | |
| AUD | 0.33% | 0.18% | 0.09% | -0.13% | 0.25% | 0.12% | 0.14% | |
| NZD | 0.22% | 0.07% | -0.04% | -0.20% | 0.06% | -0.12% | 0.04% | |
| CHF | 0.19% | 0.03% | -0.08% | -0.15% | 0.14% | -0.14% | -0.04% |
The heat map shows percentage changes of major currencies against each other. The base currency is picked from the left column, while the quote currency is picked from the top row. For example, if you pick the Japanese Yen from the left column and move along the horizontal line to the US Dollar, the percentage change displayed in the box will represent JPY (base)/USD (quote).
Author

Akhtar Faruqui
FXStreet
Akhtar Faruqui is a Forex Analyst based in New Delhi, India. With a keen eye for market trends and a passion for dissecting complex financial dynamics, he is dedicated to delivering accurate and insightful Forex news and analysis.


