USD/JPY Price Analysis: Rising wedge, Japan intervention fears prod Yen pair buyers at 144.00


  • USD/JPY struggles to defend upside momentum at yearly top.
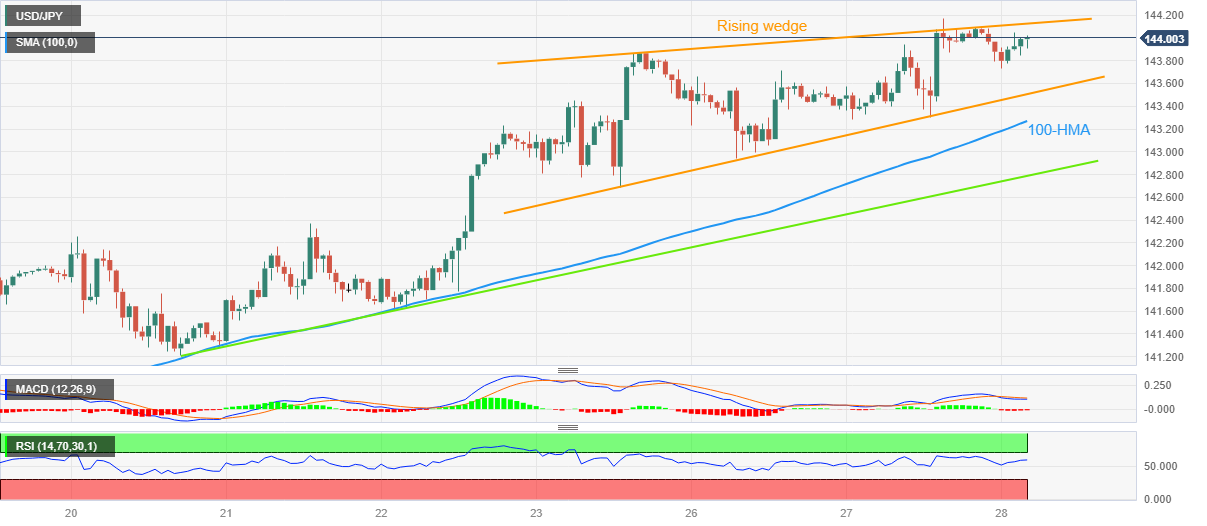
  • Rising wedge bearish chart formation, fears of Japan government intervention Yen sellers.
  • 100-HMA, one-week-long ascending support line act as additional downside filters.
  • Bulls need to provide daily closing beyond 145.10 to keep the reins.


USD/JPY buyers lack upside momentum during early Wednesday as the Yen pair seesaws near 144.00, printing mild losses heading into the European session.

The quote’s latest performance appears interesting as it stays within the weekly rising wedge bearish chart formation while making rounds to the highest levels since November 2022.

That said, the bearish MACD signals, steady RSI (14) line and chatters about the Japanese government’s market intervention also seem to challenge the USD/JPY buyers of late.

On the same line is the cautious mood ahead of Bank of Japan (BoJ) Governor Kazuo Ueda’s speech at the European Central Bank (ECB) Forum in Sintra.

With this, the USD/JPY sellers remain hopeful of consolidating the biggest monthly gains since February.

However, a clear downside break of the 143.50 support becomes necessary to confirm the bearish chart formation suggesting a theoretical target of 145.70.

Even so, the 100-Hour Moving Average (HMA) and the one-week-old rising support line, respectively near 143.30 and 142.80 act as additional downside filters to challenge the USD/JPY bears.

Meanwhile, the stated wedge’s top line of near 144.20 guards the USD/JPY pair’s immediate upside ahead of the October 2022 low of 145.10. Following that, the theoretical target of 145.70 and the 146.00 round figure may lure the pair buyers.

USD/JPY: Hourly chart

Trend: Pullback expected

Additional important levels

Overview
Today last price 143.98
Today Daily Change -0.10
Today Daily Change % -0.07%
Today daily open 144.08
 
Trends
Daily SMA20 140.88
Daily SMA50 138.19
Daily SMA100 135.88
Daily SMA200 137.22
 
Levels
Previous Daily High 144.18
Previous Daily Low 143.28
Previous Weekly High 143.87
Previous Weekly Low 141.21
Previous Monthly High 140.93
Previous Monthly Low 133.5
Daily Fibonacci 38.2% 143.83
Daily Fibonacci 61.8% 143.62
Daily Pivot Point S1 143.51
Daily Pivot Point S2 142.95
Daily Pivot Point S3 142.62
Daily Pivot Point R1 144.41
Daily Pivot Point R2 144.74
Daily Pivot Point R3 145.3


Share: Feed news

Information on these pages contains forward-looking statements that involve risks and uncertainties. Markets and instruments profiled on this page are for informational purposes only and should not in any way come across as a recommendation to buy or sell in these assets. You should do your own thorough research before making any investment decisions. FXStreet does not in any way guarantee that this information is free from mistakes, errors, or material misstatements. It also does not guarantee that this information is of a timely nature. Investing in Open Markets involves a great deal of risk, including the loss of all or a portion of your investment, as well as emotional distress. All risks, losses and costs associated with investing, including total loss of principal, are your responsibility. The views and opinions expressed in this article are those of the authors and do not necessarily reflect the official policy or position of FXStreet nor its advertisers. The author will not be held responsible for information that is found at the end of links posted on this page.

If not otherwise explicitly mentioned in the body of the article, at the time of writing, the author has no position in any stock mentioned in this article and no business relationship with any company mentioned. The author has not received compensation for writing this article, other than from FXStreet.

FXStreet and the author do not provide personalized recommendations. The author makes no representations as to the accuracy, completeness, or suitability of this information. FXStreet and the author will not be liable for any errors, omissions or any losses, injuries or damages arising from this information and its display or use. Errors and omissions excepted.

The author and FXStreet are not registered investment advisors and nothing in this article is intended to be investment advice.

XM
Account
7.2
Tools
9.2
Service
9.4
Trading
9.0
Trust
7.0
Experience
8.4
Read review
Moneta Markets
Account
7.4
Tools
6.6
Service
8.0
Trading
6.6
Trust
5.2
Experience
9.2
Read review
Trading Pro
Account
7.2
Tools
5.2
Service
6.6
Trading
8.0
Trust
5.0
Experience
7.0
Read review
Pepperstone
Account
8.2
Tools
8.2
Service
7.4
Trading
9.0
Trust
8.8
Experience
9.0
Read review
XM
Read review
Moneta Markets
Read review
Trading Pro
Read review
Pepperstone
Read review
Trading Pro
Read review
Pepperstone
Read review
XM
Read review
Moneta Markets
Read review
Trading Pro
Account
7.2
Tools
5.2
Service
6.6
Trading
8.0
Trust
5.0
Experience
7.0
Read review
Pepperstone
Account
8.2
Tools
8.2
Service
7.4
Trading
9.0
Trust
8.8
Experience
9.0
Read review
XM
Account
7.2
Tools
9.2
Service
9.4
Trading
9.0
Trust
7.0
Experience
8.4
Read review
Moneta Markets
Account
7.4
Tools
6.6
Service
8.0
Trading
6.6
Trust
5.2
Experience
9.2
Read review

Recommended content


Recommended content

Editors’ Picks

Gold falls amid a possible de-escalation of US-China tensions

Gold falls amid a possible de-escalation of US-China tensions Premium

Gold pulled back from its all-time high of $3,500 per troy ounce reached earlier on Tuesday, as a resurgent US Dollar and signs of easing tensions in the US–China trade dispute appeared to draw sellers back into the market.

Gold News
EUR/USD retreats to daily lows near 1.1440

EUR/USD retreats to daily lows near 1.1440

EUR/USD loses the grip and retreats to the 1.1440 zone as the Greenback’s rebound now gathers extra steam, particulalry after some positive headlines pointing to mitigating trade concerns on the US-China front on Tuesday.

EUR/USD News
GBP/USD deflates to weekly lows near 1.3350

GBP/USD deflates to weekly lows near 1.3350

GBP/USD loses further momentum and recedes to the 1.3350 zone on Tuesday, or two-day troughs, all in response to the frmer tone in the US Dollar and encouraging news from the US-China trade scenario.

GBP/USD News
Ethereum rallies 10% amid decline in CME short positions

Ethereum rallies 10% amid decline in CME short positions

Ethereum saw a 10% gain on Tuesday after the general crypto market rallied alongside Bitcoin. The rally comes after the ETH Chicago Mercantile Exchange basis plunged from 20% in November to about 5% in April.

Read more
Five fundamentals for the week: Traders confront the trade war, important surveys, key Fed speech

Five fundamentals for the week: Traders confront the trade war, important surveys, key Fed speech Premium

Will the US strike a trade deal with Japan? That would be positive progress. However, recent developments are not that positive, and there's only one certainty: headlines will dominate markets. Fresh US economic data is also of interest.

Read more
The Best brokers to trade EUR/USD

The Best brokers to trade EUR/USD

SPONSORED Discover the top brokers for trading EUR/USD in 2025. Our list features brokers with competitive spreads, fast execution, and powerful platforms. Whether you're a beginner or an expert, find the right partner to navigate the dynamic Forex market.

Read More

Forex MAJORS

Cryptocurrencies

Signatures

Best Brokers of 2025