|

USD/JPY Price Analysis: Retreats from six-month high below 141.00 as adjacent resistance line prods bulls

  • USD/JPY eases from yearly high, snaps three-day uptrend.
  • One-week-old resistance line, overbought RSI (14) line challenge Yen pair buyers.
  • 12-day-old bullish trend channel, upbeat MACD signals and sustained trading beyond 200-SMA favor buyers.

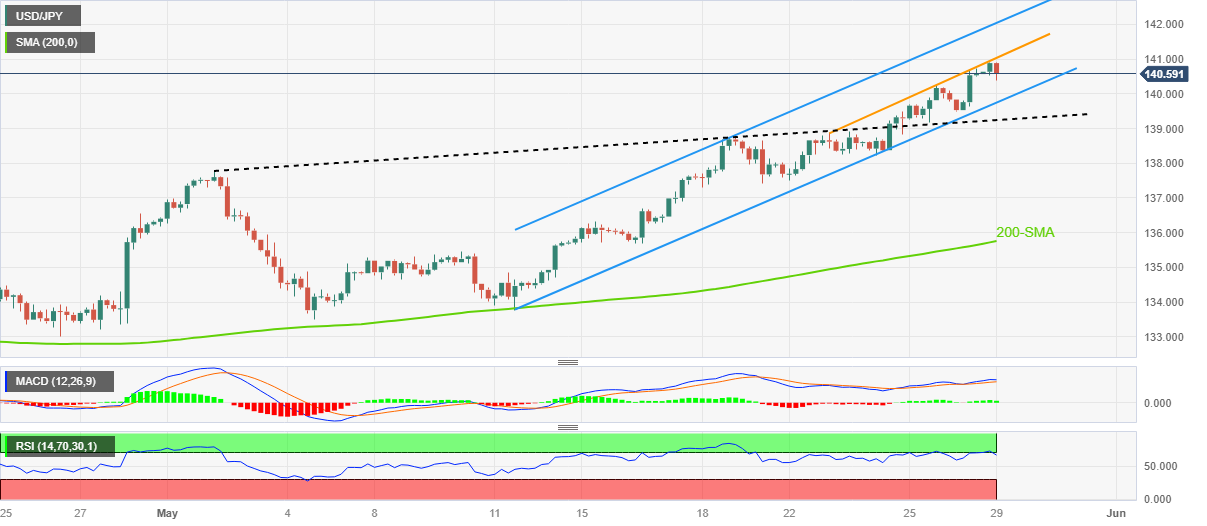
USD/JPY remains dicey at 140.60 as the Yen pair buyers struggle to extend the previous uptrend heading into Monday’s European session. In doing so, the quote also justifies the overbought RSI (14) line and the quote’s inability to cross a one-week-old ascending resistance line.

Even so, bullish MACD signals and a two-week-old ascending trend channel, as well as the quote’s ability to stay firmer past 200-SMA, keeps the USD/JPY buyers hopeful.

Hence, the quote’s latest pullback remains elusive unless it breaks the 200-SMA support level of 135.75.

Following that, the monthly low o around 133.50 and the 130.00 psychological magnet could act as the last defense of the USD/JPY buyers.

That said, the aforementioned channel’s bottom line and a previous resistance line from May 02, respectively near 139.75 and 139.20, could act as intermediate halts to watch during the Yen pair’s weakness.

Alternatively, an upside break of the weekly resistance line, close to 141.05 at the latest, could propel the USD/JPY towards the aforementioned channel’s peak of near 142.00 However, the six-month high to around 142.25, comprising the late November 2022 peak, can act as the final battle to be won for the Yen pair buyers before retaking the control.

USD/JPY: Four-hour chart

Trend: Bullish

Additional important levels

Overview
Today last price140.61
Today Daily Change-0.03
Today Daily Change %-0.02%
Today daily open140.64
 
Trends
Daily SMA20136.84
Daily SMA50134.49
Daily SMA100133.51
Daily SMA200137.23
 
Levels
Previous Daily High140.72
Previous Daily Low139.5
Previous Weekly High140.72
Previous Weekly Low137.49
Previous Monthly High136.56
Previous Monthly Low130.63
Daily Fibonacci 38.2%140.26
Daily Fibonacci 61.8%139.96
Daily Pivot Point S1139.85
Daily Pivot Point S2139.06
Daily Pivot Point S3138.62
Daily Pivot Point R1141.08
Daily Pivot Point R2141.52
Daily Pivot Point R3142.31

Author

Anil Panchal

Anil Panchal

FXStreet

Anil Panchal has nearly 15 years of experience in tracking financial markets. With a keen interest in macroeconomics, Anil aptly tracks global news/updates and stays well-informed about the global financial moves and their implications.

More from Anil Panchal
Share:

Editor's Picks

EUR/USD seems fragile below 1.1700 as Middle East war boosts energy prices

The EUR/USD pair trades flat at around 1.1680 during the Asian trading session on Tuesday, but broadly seems vulnerable, being close to its five-week low. The major currency pair is under pressure as surging oil prices due to the United States-Israel war with Iran have increased the risks of higher inflation for the Old Continent.

GBP/USD hovers around 1.3400 with bearish pressure intact

GBP/USD edges higher after three days of losses, trading around 1.3400 during the Asian hours on Tuesday. The technical analysis of the daily chart indicates an ongoing bearish bias, as the pair trades within a descending channel pattern.

Gold stays bullish as Iran war continues to spur safe-haven flows

Gold is finding renewed bids in Asian trades on Tuesday, making another attempt to regain the $5,400 level amid persistent demand for safe-haven assets as the Iran war extends. A softer risk tone remains in play as US President Donald Trump continues to threaten deeper escalation to the ongoing war with Iran, warning that a “big wave” is yet to come.

Top Crypto Gainers: Near Protocol, Virtuals Protocol, and Morpho lead market recovery

Near Protocol, Virtuals Protocol, and Morpho are leading the market recovery with double-digit gains over the last 24 hours. Technically, NEAR extends the breakout of the falling channel pattern, VIRTUAL holds above the 50-day EMA, while MORPHO tests a crucial resistance. 

The market is not panicking it is repricing the probability distribution of Oil and time

At the end of the day, markets do not trade morality or geopolitics. They trade transmission channels. And the only channel that truly matters in this maelstrom runs through the price of energy and the time value of money.

Grass 20% bullish breakout defies broader market weakness

Grass (GRASS) is edging up above $0.30 at the time of writing on Monday. The token’s notable 20% intraday surge stands out amid heightened volatility in the broader crypto market.