USD/JPY Price Analysis: Retreats from monthly horizontal hurdle near 115.50
- USD/JPY bounces off intraday low, seesaws around short-term key resistance area.
- Crucial SMAs, firmer RSI can keep buyers hopeful amid sluggish trading.
- Clear break of five-week-old rising trend line adds strength to the bearish bias.

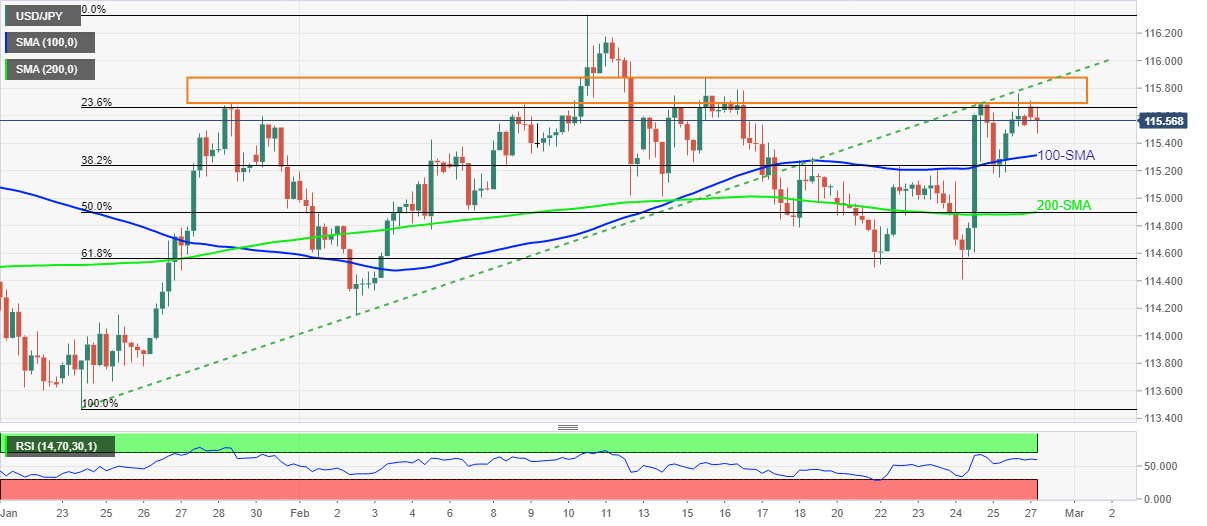
USD/JPY struggles for clear directions around 115.55 amid Monday’s Asian session, after stepping back from one-month-old horizontal resistance the previous day.
In addition to the aforementioned horizontal resistance area, around 115.70-90, the pair’s sustained trading below the previous support line from January 24, at 115.85 by the press time, also keeps USD/JPY sellers hopeful.
Hence, the quote’s further weakness towards the 100-SMA level of 115.30 can’t be ruled out.
However, a convergence of the 200-SMA and 50% Fibonacci retracement (Fibo.) of January-February upside, at 114.90, will challenge USD/JPY bears afterward.
Should USD/JPY bears dominate past 114.90, the monthly low of 114.15 will be in focus.
On the contrary, a clear upside break of 115.90 won’t hesitate to poke the monthly high of 116.33.
Though, tops marked in January around 116.35, will add strength to the 116.30-35 resistance zone, a break of which will propel the quote towards the late 2016 peak near 118.70.
USD/JPY: Four-hour chart
Trend: Further weakness expected
Author

Anil Panchal
FXStreet
Anil Panchal has nearly 15 years of experience in tracking financial markets. With a keen interest in macroeconomics, Anil aptly tracks global news/updates and stays well-informed about the global financial moves and their implications.


