USD/JPY Price Analysis: Refreshes multi-month tops ahead of Powell, eyeing mid-107.00s


  • USD/JPY continued scaling higher on Thursday and shot to near seven-month tops.
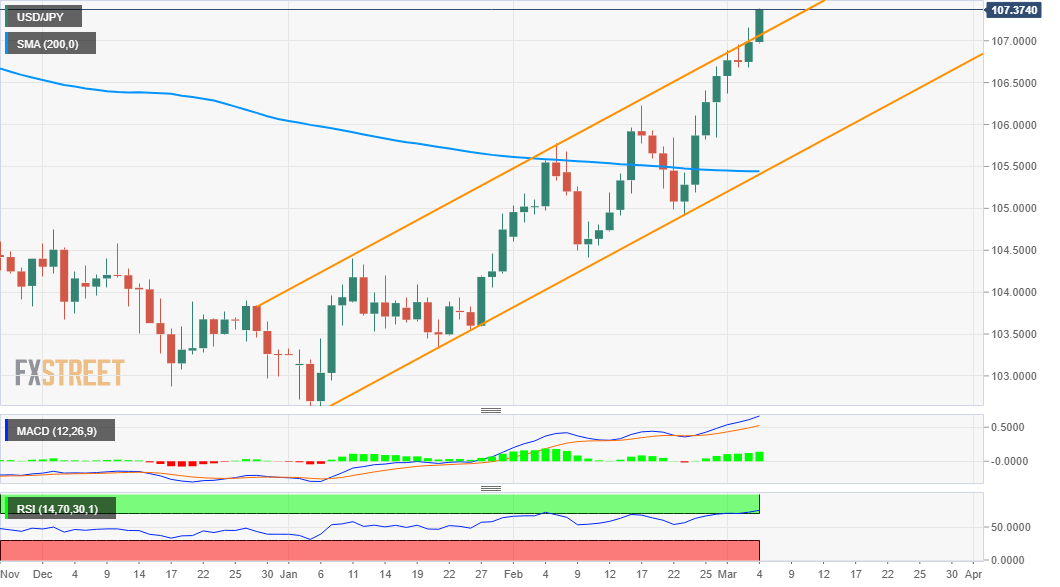
  • The momentum confirmed a fresh bullish breakout through an ascending channel.
  • Slightly overbought RSI on the daily chart warrants some caution for bullish traders.

The USD/JPY pair maintained its strong bid tone through the mid-European session and was last seen hovering near the 107.35 region, or the highest level since July 2020.

Sustained US dollar buying, despite a softer tone surrounding the US Treasury bond yields, was seen as one of the key factors driving the USD/JPY pair higher. Bulls seemed rather unaffected by a modest pullback in the equity markets, which tends to underpin demand for the safe-haven Japanese yen.

From a technical perspective, the momentum pushed the USD/JPY pair beyond a resistance marked by the top boundary of an over two-month-old ascending channel. This might be seen as a fresh trigger for bullish traders and might have already set the stage for an extension of the ongoing positive move.

That said, RSI (14) on the daily chart has moved above the 70 mark and points to slightly overbought conditions. This, in turn, warrants some caution before positioning for any further appreciating move ahead of the Fed Chair Jerome Powell's scheduled speech later during the North American session.

Nevertheless, the USD/JPY pair seems poised to prolong the strong momentum further beyond the 107.60 congestion zone and aim to reclaim the 108.00 round-figure mark for the first time since July 2020.

On the flip side, any pullback might now find some support near the trend-channel resistance breakpoint ahead of the 107.00 mark. Further weakness might be seen as a buying opportunity and remain limited near the 106.70-65 horizontal zone, which should now act as a strong base for the USD/JPY pair.

Only a sustained break below will negate the near-term constructive outlook. The USD/JPY pair might then accelerate the corrective slide towards the 106.00 mark en-route the 105.50 confluence support, comprising of the very important 200-day SMA and the lower boundary of the mentioned channel.

USD/JPY daily chart

fxsoriginal

Technical levels to watch

USD/JPY

Overview
Today last price 107.38
Today Daily Change 0.40
Today Daily Change % 0.37
Today daily open 106.98
 
Trends
Daily SMA20 105.64
Daily SMA50 104.55
Daily SMA100 104.45
Daily SMA200 105.44
 
Levels
Previous Daily High 107.16
Previous Daily Low 106.68
Previous Weekly High 106.69
Previous Weekly Low 104.92
Previous Monthly High 106.69
Previous Monthly Low 104.41
Daily Fibonacci 38.2% 106.97
Daily Fibonacci 61.8% 106.86
Daily Pivot Point S1 106.73
Daily Pivot Point S2 106.47
Daily Pivot Point S3 106.25
Daily Pivot Point R1 107.2
Daily Pivot Point R2 107.41
Daily Pivot Point R3 107.67


Share: Feed news

Information on these pages contains forward-looking statements that involve risks and uncertainties. Markets and instruments profiled on this page are for informational purposes only and should not in any way come across as a recommendation to buy or sell in these assets. You should do your own thorough research before making any investment decisions. FXStreet does not in any way guarantee that this information is free from mistakes, errors, or material misstatements. It also does not guarantee that this information is of a timely nature. Investing in Open Markets involves a great deal of risk, including the loss of all or a portion of your investment, as well as emotional distress. All risks, losses and costs associated with investing, including total loss of principal, are your responsibility. The views and opinions expressed in this article are those of the authors and do not necessarily reflect the official policy or position of FXStreet nor its advertisers. The author will not be held responsible for information that is found at the end of links posted on this page.

If not otherwise explicitly mentioned in the body of the article, at the time of writing, the author has no position in any stock mentioned in this article and no business relationship with any company mentioned. The author has not received compensation for writing this article, other than from FXStreet.

FXStreet and the author do not provide personalized recommendations. The author makes no representations as to the accuracy, completeness, or suitability of this information. FXStreet and the author will not be liable for any errors, omissions or any losses, injuries or damages arising from this information and its display or use. Errors and omissions excepted.

The author and FXStreet are not registered investment advisors and nothing in this article is intended to be investment advice.

Recommended content


Recommended content

Editors’ Picks

AUD/USD could extend the recovery to 0.6500 and above

AUD/USD could extend the recovery to 0.6500 and above

The enhanced risk appetite and the weakening of the Greenback enabled AUD/USD to build on the promising start to the week and trade closer to the key barrier at 0.6500 the figure ahead of key inflation figures in Australia.

AUD/USD News

EUR/USD now refocuses on the 200-day SMA

EUR/USD now refocuses on the 200-day SMA

EUR/USD extended its positive momentum and rose above the 1.0700 yardstick, driven by the intense PMI-led retracement in the US Dollar as well as a prevailing risk-friendly environment in the FX universe.

EUR/USD News

Gold struggles around $2,325 despite broad US Dollar’s weakness

Gold struggles around $2,325 despite broad US Dollar’s weakness

Gold reversed its direction and rose to the $2,320 area, erasing a large portion of its daily losses in the process. The benchmark 10-year US Treasury bond yield stays in the red below 4.6% following the weak US PMI data and supports XAU/USD.

Gold News

Bitcoin price makes run for previous cycle highs as Morgan Stanley pushes BTC ETF exposure

Bitcoin price makes run for previous cycle highs as Morgan Stanley pushes BTC ETF exposure

Bitcoin (BTC) price strength continues to grow, three days after the fourth halving. Optimism continues to abound in the market as Bitcoiners envision a reclamation of previous cycle highs.

Read more

US versus the Eurozone: Inflation divergence causes monetary desynchronization

US versus the Eurozone: Inflation divergence causes monetary desynchronization

Historically there is a very close correlation between changes in US Treasury yields and German Bund yields. This is relevant at the current juncture, considering that the recent hawkish twist in the tone of the Federal Reserve might continue to push US long-term interest rates higher and put upward pressure on bond yields in the Eurozone. 

Read more

Forex MAJORS

Cryptocurrencies

Signatures