|

USD/JPY Price Analysis: How far can this rally go?

  • USD/JPY bears are moving in and the daily W-formation is compelling. 
  • The bulls, however, may only be a correction away. 

USD/JPY is likely due for a correction, but that is not to say that the monthly rally can't carry on in due course. Casting eyes back over the monthly charts, albeit well into the past, in 1998, the yen rallied for three consecutive months and tallied gains of some 24% from when USD/JPY fell from 147.67 to 111.88:

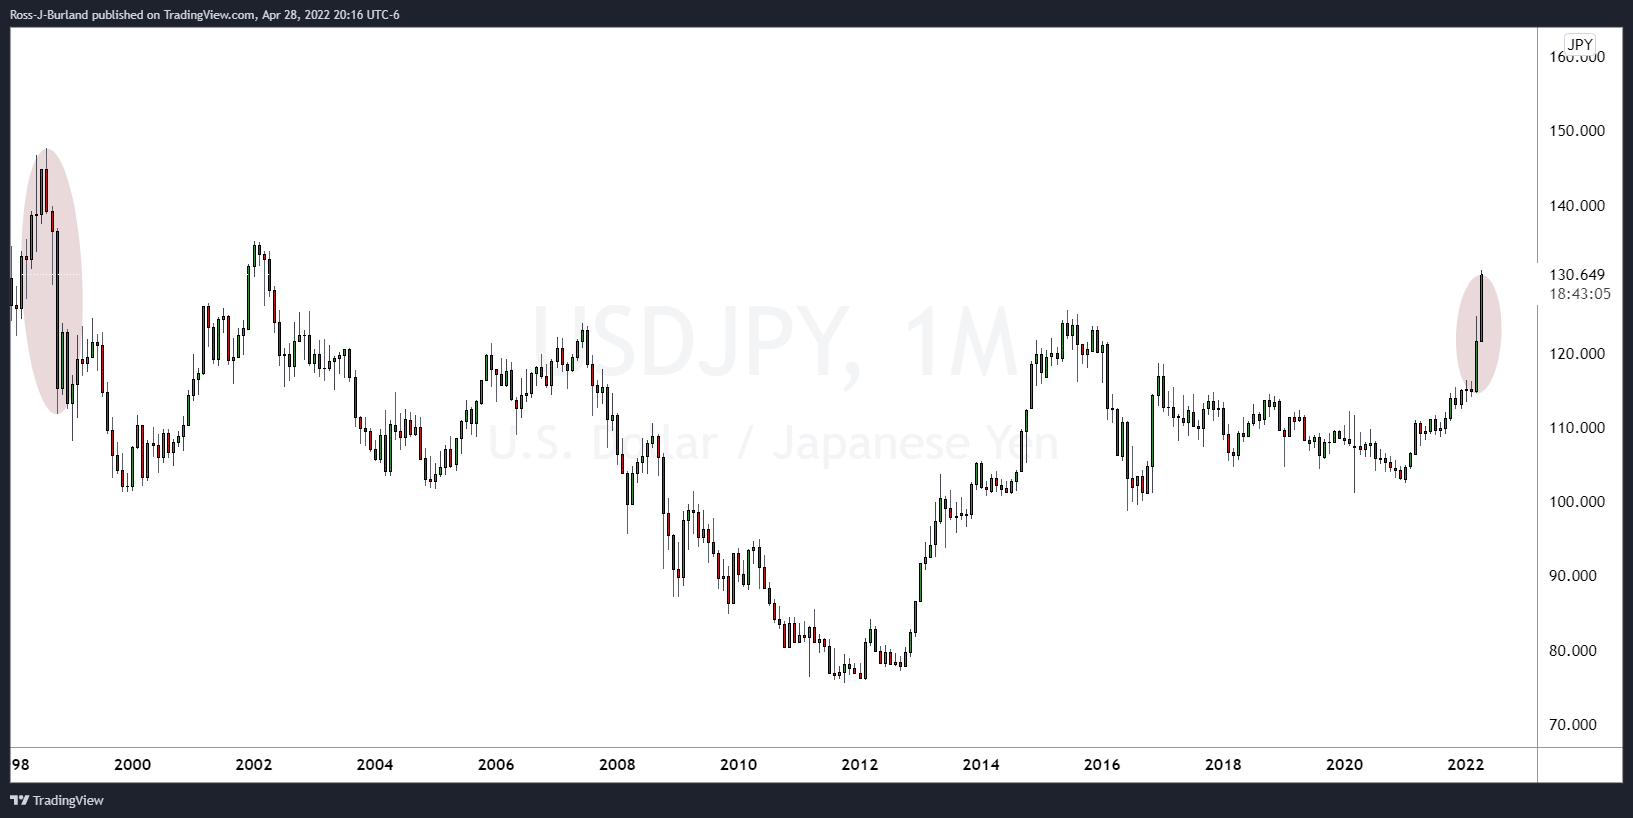
(USD/JPY monthly chart)

For the meanwhile, the DXY chart could be regarded as moving into a phase of meanwhile distribution, which is common ahead of major events such as the Federal reserve and Nonfarm Payrolls at the end of the month:
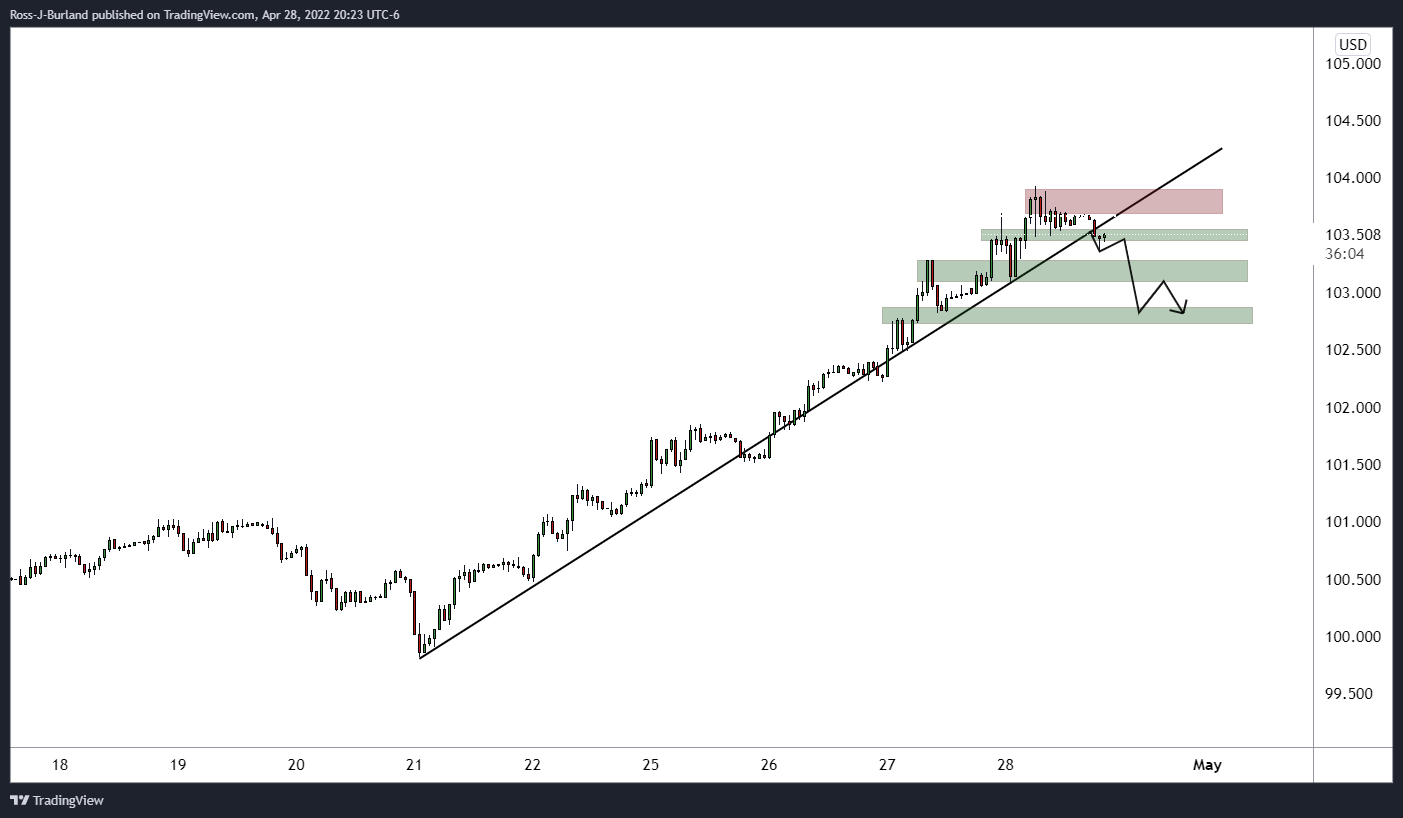
(DXY H1 chart)

This leaves scope for a meanwhile correction in USD/JPY:

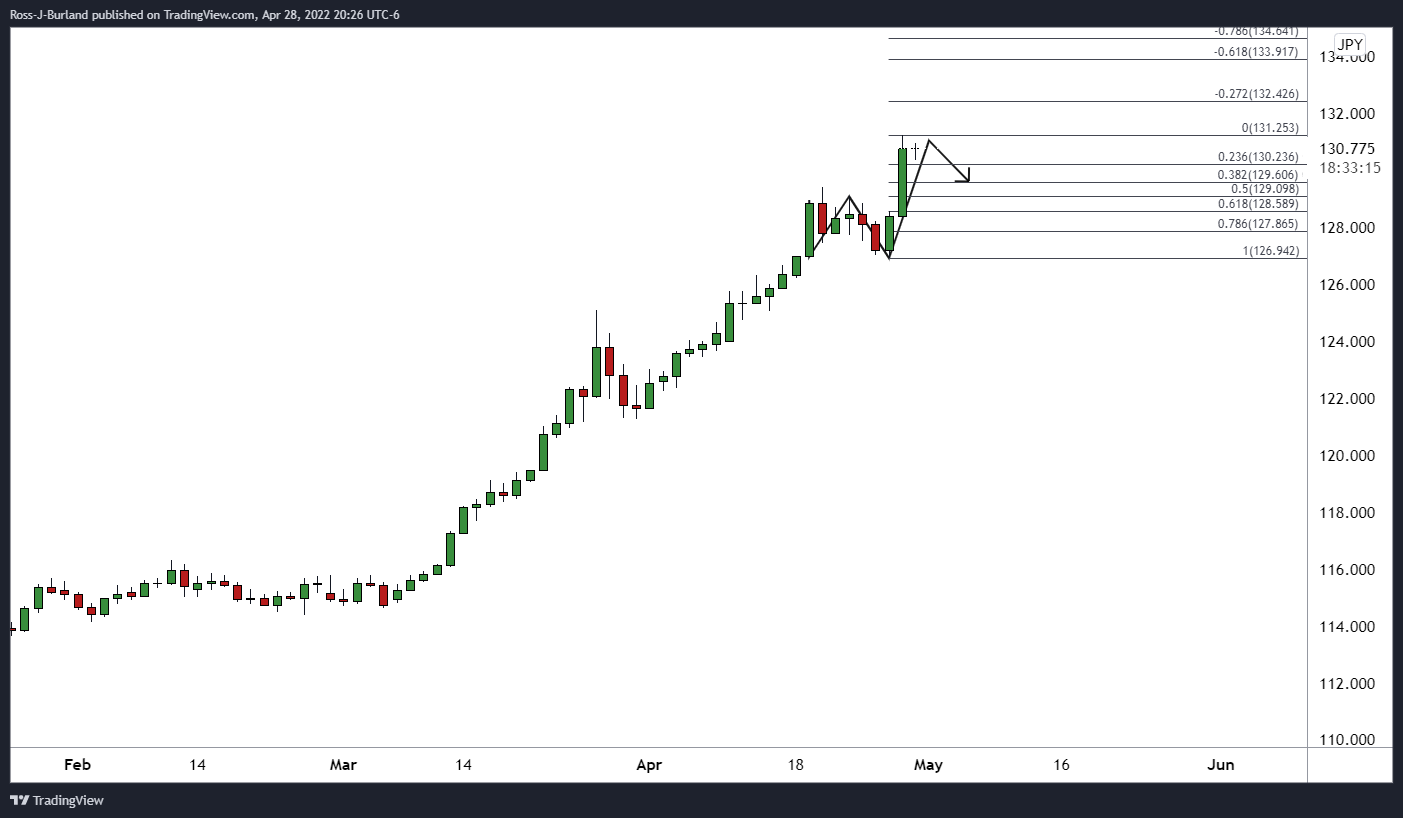
The daily chart has painted a W-formation which is a reversion pattern and the price would be expected to revert towards the neckline, near the 50% mean reversion level around 129 the figure. 

Author

Ross J Burland

Ross J Burland, born in England, UK, is a sportsman at heart. He played Rugby and Judo for his county, Kent and the South East of England Rugby team.

More from Ross J Burland
Share:

Editor's Picks

EUR/USD treads water above 1.1850 amid thin trading

EUR/USD stays defensive but holds 1.1850 amid quiet markets in the European hours on Monday.  The US Dollar is struggling for direction due to thin liquidity conditions as US markets are closed in observance of Presidents' Day. 

GBP/USD flat lines as traders await key UK and US macro data

GBP/USD kicks off a new week on a subdued note and oscillates in a narrow range near 1.365 in Monday's European trading. The mixed fundamental backdrop warrants some caution for aggressive traders as the market focus now shifts to this week's important releases from the UK and the US.

Gold sticks to intraday losses; lacks follow-through

Gold remains depressed through the early European session on Monday, though it has managed to rebound from the daily trough and currently trades around the $5,000 psychological mark. Moreover, a combination of supporting factors warrants some caution for aggressive bearish traders, and before positioning for deeper losses.

Bitcoin, Ethereum and Ripple consolidate within key ranges as selling pressure eases

Bitcoin and Ethereum prices have been trading sideways within key ranges following the massive correction. Meanwhile, XRP recovers slightly, breaking above the key resistance zone. The top three cryptocurrencies hint at a potential short-term recovery, with momentum indicators showing fading bearish signs.

Global inflation watch: Signs of cooling services inflation

Realized inflation landed close to expectations in January, as negative base effects weighed on the annual rates. Remaining sticky inflation is largely explained by services, while tariff-driven goods inflation remains limited even in the US.

Monero Price Forecast: XMR risks a drop below $300 under mounting bearish pressure

Monero (XMR) starts the week under pressure, recording a 4% decline at press time on Monday after a 7% drop the previous day, putting the $300 support zone in focus.