|

USD/JPY Price Analysis: Hidden bullish divergence, rising channel favor run-up beyond 130.00

  • USD/JPY extends the previous day’s rebound to refresh weekly top.
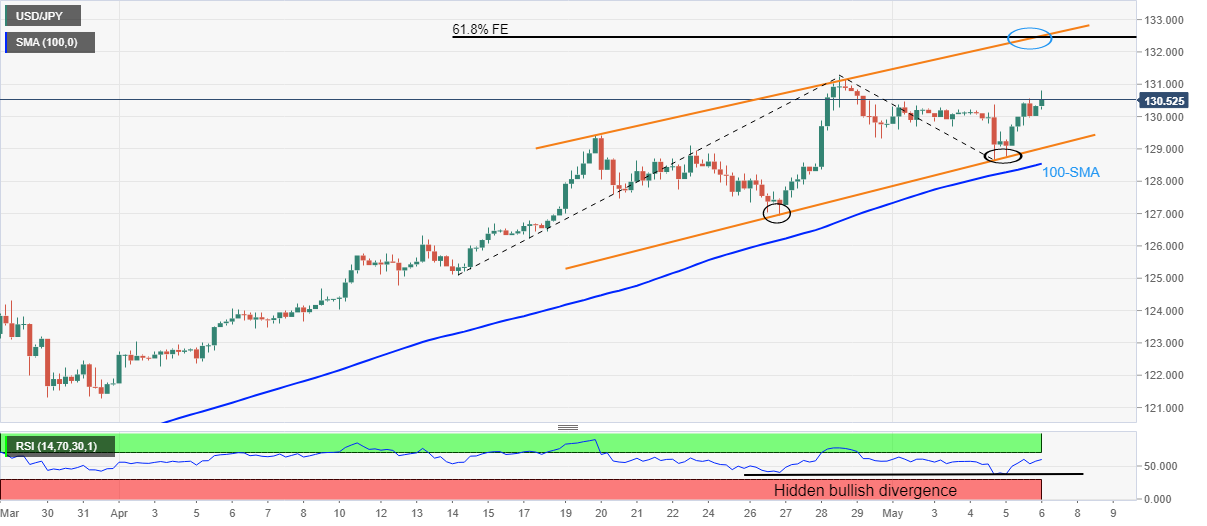
  • Ascending trend channel, bullish RSI divergence keep buyers hopeful.
  • 61.8% FE, channel’s resistance challenge bulls, 100-SMA acts as additional downside filter.

USD/JPY remains on the front foot around the weekly top surrounding 130.50 during Friday’s Asian session. The yen pair’s latest gains could be well linked to the market’s rush to risk safety and Japan’s return from holidays.

Technically, hidden bullish divergence of the RSI and USD/JPY prices join a 13-day-old rising channel to underpin the latest run-up.

The aforementioned divergence takes place when prices make higher high but the indicator, here RSI, prints lower low. The divergence hints at a gradual pick-up in the upside momentum backed by the buyer’s confidence.

That said, the quote is well-directed towards the previous monthly top near 131.15. However, a convergence of the stated channel’s upper line nad 61.8% Fibonacci Expansion (FE) of April 14 to May 04 upside, around 132.50, appears a tough nut to crack for the USD/JPY bulls.

Alternatively, pullback moves remain elusive beyond the channel’s support line, close to 129.00 by the press time. Also acting as the key support is the 100-SMA level near 128.55.

Overall, USD/JPY maintains the bullish trajectory but will be tested for further advances soon.

USD/JPY: Four-hour chart

Trend: Further upside expected

Additional important levels

Overview
Today last price130.53
Today Daily Change0.31
Today Daily Change %0.24%
Today daily open130.22
 
Trends
Daily SMA20127.87
Daily SMA50122.69
Daily SMA100118.79
Daily SMA200115.38
 
Levels
Previous Daily High130.56
Previous Daily Low128.76
Previous Weekly High131.26
Previous Weekly Low126.95
Previous Monthly High131.26
Previous Monthly Low121.67
Daily Fibonacci 38.2%129.87
Daily Fibonacci 61.8%129.44
Daily Pivot Point S1129.13
Daily Pivot Point S2128.04
Daily Pivot Point S3127.33
Daily Pivot Point R1130.93
Daily Pivot Point R2131.65
Daily Pivot Point R3132.73

Author

Anil Panchal

Anil Panchal

FXStreet

Anil Panchal has nearly 15 years of experience in tracking financial markets. With a keen interest in macroeconomics, Anil aptly tracks global news/updates and stays well-informed about the global financial moves and their implications.

More from Anil Panchal
Share:

Editor's Picks

EUR/USD rebounds from session lows, stays below 1.1650

EUR/USD is recovers modestly from session lows but remains in the red below 1.1650 in European trading on Thursday. The pair faces headwinds from a renewed uptick in the US Dollar amid a negative shift in risk sentiment. Surging energy prices due to the Middle East war keep the bearish pressure intact on the Euro. The US Jobless Claims data are next of note. 

GBP/USD stays weak near 1.3350 amid UK stagflation risks

GBP/USD sticks to losses near 1.3350 in the European session on Thursday. The Pound Sterling loses ground amid fears that the United Kingdom economy could face stagflation risks due to higher energy prices, while the US Dollar attracts fresh havem demand ahead of the US Jobless Claims data. 

Gold climbs near $5,200 as Iran war fuels safe-haven demand

Gold price extends its gains for the second successive session on Thursday as traders seek safety amid the ongoing war in the Middle East. US and Israeli strikes across Iranian territory and widespread Iranian missile and drone retaliation across the Middle East, including attacks on regional targets and military sites, prolong the crisis and its impact.

Three reasons to be bearish on Bitcoin

Bitcoin is holding up well taking into account the uncertainty stemming from the Middle East. Despite this week’s rally, the long-term outlook remains bearish. Here are three reasons why I think the storm for the largest cryptocurrency isn't over yet.

Markets attempt to rally on positive news from Iran

There’s been an abrupt change in sentiment this morning, European stock markets are higher and oil and gas prices are moderating, after comments from Iran’s deputy minister about pre-conflict talks between Iran and the US.

Cardano Price Analysis: Approaches key trendline amid bearish sentiment

Cardano (ADA) price is approaching its descending trendline around $0.28 at the time of writing, set to shape the next directional move. The derivatives metrics paint a bearish picture, with ADA’s Open Interest continuing to fall and short bets rising among traders.