|

USD/JPY Price Analysis: Grinds near 144.50 within weekly triangle, depicts cautious mood

  • USD/JPY struggles within weekly trading range near YTD high amid sluggish sentiment.
  • Cautious mood ahead of Fed Minutes, Japan intervention fears and recession woes prod sentiment.
  • Downbeat RSI suggests Yen pair’s gradual grinding towards the south but 200-HMA appears the key support.
  • Bulls have a bumpy road towards the north to travel even if they cross 144.65 immediate hurdle.

USD/JPY aptly portrays the market’s indecision around mid-144.00s as traders await the week’s key catalysts amid early Wednesday in Europe. In doing so, the Yen pair seesaws within a symmetrical triangle comprising multiple levels marked since June 30.

Among the headline catalysts, the US-China tussles, recession woes and Japan’s market intervention gain major attention. Additionally, amplifying the cautious mood is the wait for the Federal Open Market Committee (FOMC) Minutes for the June meeting.

Also read: USD/JPY consolidates in a range around mid-144.00s, just below YTD peak

With this, the USD/JPY pair remains sidelined within the weekly triangle, currently between 144.65 and 144.30.

However, the downward-sloping RSI (14) line suggests that the buyers are running out of steam as they repeatedly failed to refresh the Year-To-Date (YTD) high in the last one week.

As a result, the Yen pair is likely to break the 144.30 support and can please the bears.

Though, an upward-sloping trend line from June 20 and the 200-Hour Moving Average (HMA), respectively near 144.20 and 144.10, quickly followed by the 144.00 round figure, can challenge the USD/JPY bears before giving them control.

On the contrary, an upside break of the 144.65 hurdle will need validation from a horizontal area comprising the recent multi-month peak and October 2022 low of near 145.10.

Following that, September 2022 high of near 145.95 and the late October top surrounding 148.85 can challenge the USD/JPY bulls.

USD/JPY: Hourly chart
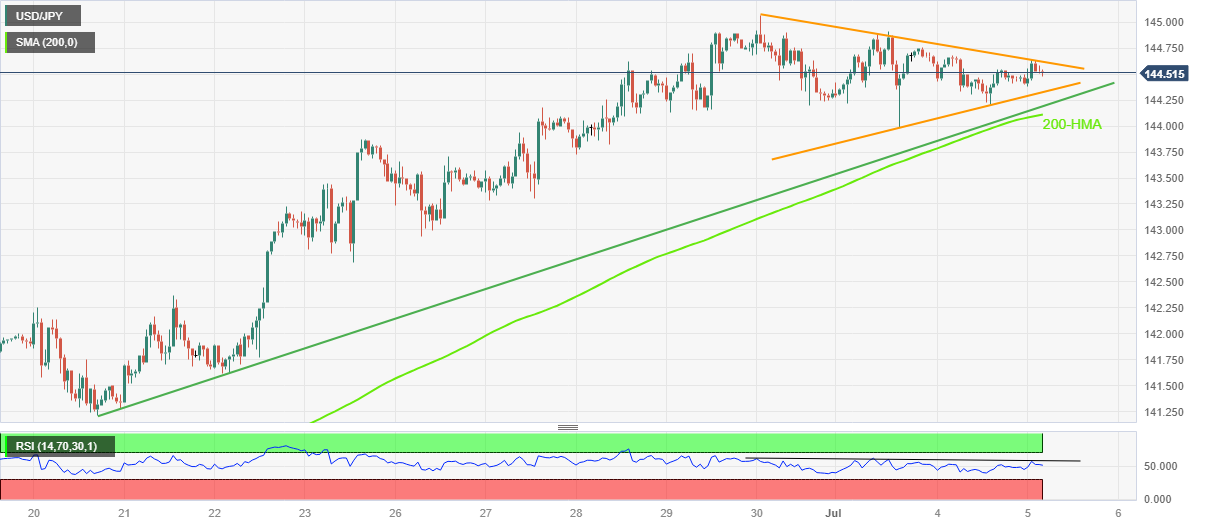
Trend: Pullback expected

Additional important levels

Overview
Today last price144.53
Today Daily Change0.07
Today Daily Change %0.05%
Today daily open144.46
 
Trends
Daily SMA20142.15
Daily SMA50139.22
Daily SMA100136.51
Daily SMA200137.23
 
Levels
Previous Daily High144.71
Previous Daily Low144.21
Previous Weekly High145.07
Previous Weekly Low142.94
Previous Monthly High145.07
Previous Monthly Low138.43
Daily Fibonacci 38.2%144.4
Daily Fibonacci 61.8%144.52
Daily Pivot Point S1144.21
Daily Pivot Point S2143.96
Daily Pivot Point S3143.71
Daily Pivot Point R1144.71
Daily Pivot Point R2144.96
Daily Pivot Point R3145.21

Author

Anil Panchal

Anil Panchal

FXStreet

Anil Panchal has nearly 15 years of experience in tracking financial markets. With a keen interest in macroeconomics, Anil aptly tracks global news/updates and stays well-informed about the global financial moves and their implications.


More from Anil Panchal
Share:

Editor's Picks

AUD/USD flirts with 0.7000, lowest since early August amid bullish USD

AUD/USD hits a fresh low since early August during the Asian session on Friday and looks vulnerable near 0.7000 after breaking below the 200-day SMA overnight. Against the backdrop of the hawkish Fed, a two-day rally in oil prices revives inflation fears and continues to push US bond yields to multi-year highs. Adding to this, geopolitical risks lift the US Dollar to a two-month high, overshadowing RBA rate hike bets and weighing on the pair.

USD/JPY pulls back from three-week high after failing near 159.00

USD/JPY edges lower during the Asian session on Friday, stalling its recent strong move to a three-week high of 159.00 as Japanese Yen bears turn cautious amid intervention fears. Meanwhile, the US Dollar retains a strong bullish undertone as the Fed's hawkish outlook and oil-driven inflation fears continue to push US bond yields to multi-year peaks. Furthermore, the BoJ's dovish rate hike last week might cap JPY and support spot prices.

Gold treads water below $4,300

Gold grabs some buying attention and advances marginally at the end of the week, partially retracing the weekly decline, although it is still navigating below the key $4,300 mark per troy ounce. The fresh selling bias on the Greenback and the modest decline in US Treasury yields appear to support the humble advance in the precious metal.

Crypto Today: Bitcoin and Ethereum edge lower, XRP extends recovery as macro headwinds weigh

The broader cryptocurrency market is consolidating on Friday, with Bitcoin paring losses slightly above $84,000. Ethereum declines in tandem with BTC. Ripple (XRP), meanwhile, paints a different picture.


Fed vs BoJ: Both hiked. The market only believes one of them – and the chart shows which
The Federal Reserve (Fed) and the Bank of Japan (BoJ) have just done something remarkably similar. Both central banks raised interest rates by 25 basis points (bps) last week, both are confronting inflation risks, and both signal that future decisions will depend on incoming economic data.
Fed vs BoJ: Both hiked. The market only believes one of them – and the chart shows which

The Fed and the BoJ have just done something remarkably similar. Both central banks raised interest rates by 25 bps last week, both are confronting inflation risks, and both signal that future decisions will depend on incoming economic data.













